Skip over navigation


This activity aims to highlight relationships between the graphic, numeric and verbal representation systems used in measuring probability.
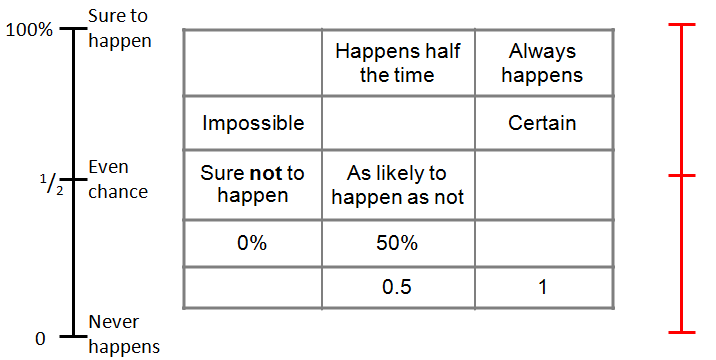
Show where the labels marked on one scale belong in the grid.
Choose the labels you prefer for your own probability scale.
Mark the probabilities of some events onto the scales.
Small-group discussion concluding with a brief period of whole-class review
Organise the students to work in groups.
Ask groups to look at the example of a probability scale on the left-hand side of the diagram, and to agree where each of the labels used there belongs in the grid in the centre of the diagram.
Ask groups next to agree what labels to put on their own preferred probability scale, waiting on the right of the diagram.
Ask groups finally to mark some probabilities on the scales, to check that they agree how they operate. Examples of probabilities should be taken from earlier in the lesson, and from their own suggestions.
This activity does not require a long whole-class debriefing - but you might ask one or two groups to report back to the whole class on how they have designed their scale and (crucially) their reasons for choosing the labels involved.


Tools for Thinking about Probability
Age 11 to 14
Challenge Level 

This activity was developed by the epiSTEMe project. More information about the project, and the other epiSTEMe activities available on NRICH, can be found here.
Design your own Probability Scale
This activity aims to highlight relationships between the graphic, numeric and verbal representation systems used in measuring probability.
Activity
Show where the labels marked on one scale belong in the grid.
Choose the labels you prefer for your own probability scale.
Mark the probabilities of some events onto the scales.
Organise the students to work in groups.
Ask groups to look at the example of a probability scale on the left-hand side of the diagram, and to agree where each of the labels used there belongs in the grid in the centre of the diagram.
Ask groups next to agree what labels to put on their own preferred probability scale, waiting on the right of the diagram.
Ask groups finally to mark some probabilities on the scales, to check that they agree how they operate. Examples of probabilities should be taken from earlier in the lesson, and from their own suggestions.
This activity does not require a long whole-class debriefing - but you might ask one or two groups to report back to the whole class on how they have designed their scale and (crucially) their reasons for choosing the labels involved.
You may also like
What Do You Know about Probability? (1)
What is special about dice?
How can we use dice to explore probability?
What do you know about Probability? (2)
What are the likelihoods of different events when you roll a dice?
A Brief History of Probability
Can you help d'Alembert discover the probabilty of at least one head in two coin flips?