Graph Area


Plotting the graph using a table of values
If we plot the graph first, then we will be able to see the shape whose area we are looking for.
We can use a table of values to plot the graph, and we are interested in $x$ values between $3$ and $7$, so going from $2$ to $8$ will help us see the whole shape.
If $x=2$, then $y=2\times2-6=4-6=-2$. The rest of the values can be found in the same way.
| $x$ | $2$ | $3$ | $4$ | $5$ | $6$ | $7$ | $8$ |
| $y$ | $-2$ | $0$ | $2$ | $4$ | $6$ | $8$ | $10$ |
The graph looks like this:
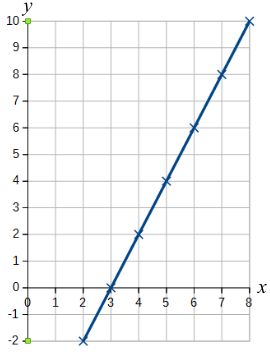
We need to find the area between $x=3$ and $x=7$, which is coloured green below.
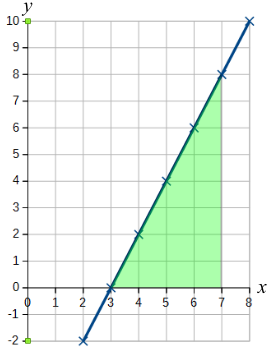
The shape is a right-angled triangle, and its base is $4$ units and its height is $8$ units. So its area is $\frac{1}{2}\times4\times8=16$ square units.
Sketching the graph using relevant points
From the equation $y=2x-6$, we know that the graph will be a straight line.
Since we are interested in the area between $x=3$ and $x=7$, we could check where the graph is at those two points.
When $x=3$, $y=2\times3-6=6-6=0$.
When $x=7$, $y=2\times7-6=14-6=8$.
So $(3,0)$ and $(7,8)$ lie on the graph.

So the graph must be the straight line through those points, and the area required is the green area, as shown below.

The shape is a right-angled triangle, and its base is $4$ units and its height is $8$ units. So its area is $\frac{1}{2}\times4\times8=16$ square units.
Related Collections
You may also like
Consecutive Numbers
An investigation involving adding and subtracting sets of consecutive numbers. Lots to find out, lots to explore.
Days and Dates
Investigate how you can work out what day of the week your birthday will be on next year, and the year after...