Skip over navigation


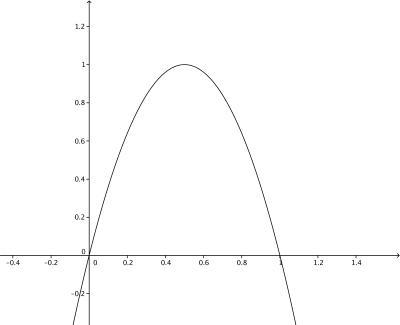
Consider the quadratic equation: $$y = 4x - 4x^2$$
It seems like a pretty ordinary equation, nothing much to get excited about. Here is its graph:
Now use your calculator to plug in some numbers. Start with a value for x, say x=0.2, apply your equation and get y=0.64.
Now try again, this time using this new value for x: plug in x=0.64 and get y=0.9216.
Go again, with the new value x=0.9216 and get y=0.28901376.
Carry on repeating this process (called iterating) for as long as takes your fancy, and you'll get a sequence of numbers:
0.2, 0.64, 0.9216, 0.28901376, 0.8219392261, 0.5854205387, 0.9708133262, ...
What do you think would have happened if you'd started this process with value of 0.2001 for x rather than 0.2? Those two numbers are very close, almost the same, so you would think they'd produce a fairly similar sequence of numbers...
You might like to try it for yourself, perhaps using a spreadsheet, before reading on.
Here is what happens for the two different starting values, plotted out in blue for the sequence of numbers when you start with x=0.2 and red for the sequence that started with x=0.2001:
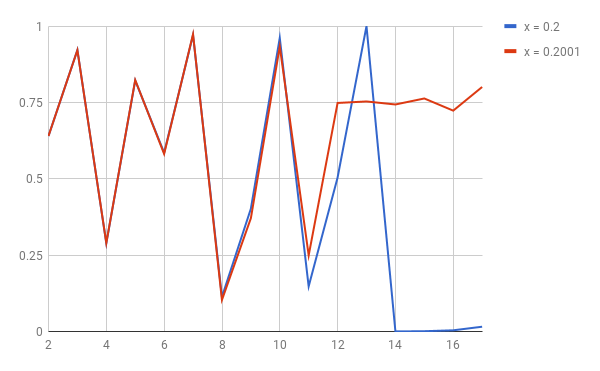
For the first 8 or so times you plug the numbers back into the equation, you get a fairly similar sequence of numbers - it's very hard to distinguish between the red and blue lines in the chart for those 8 values. Then you begin to see the two lines diverging, and by the 12th iteration, they are wildly out of kilter with each other! Are you surprised that just a small difference in the starting value results in wildly different behaviour in just a few steps?
This behaviour was first encountered by mathematician Edward Lorenz in 1961 when he reran a computer simulation for forecasting the weather. The first time the simulation ran, it started with an initial value of 0.506127, but the second time Lorenz typed in the number by hand and rounded the number to 0.506. No one at the time would have thought such a slight difference would have an impact. But Lorenz was surprised to discover it led to very different forecasts.

Lorenz poetically describing this behaviour as “two weather situations differing by as little as the immediate influence of a single butterfly will generally after sufficient time evolve into two situations differing by as much as the presence of a tornado”.
We now call this sensitivity to initial conditions the butterfly effect and it is one of the hallmarks of mathematical chaos. One of the most surprising things about chaos theory is that it can emerge from such simple equations, such as our example above, as well as from the complex mathematics that is used in weather forecasting, predicting the stock market, and understanding social trends.
You can read more about chaos and Jurassic Park on Plus!
Utter Chaos!
Consider the quadratic equation: $$y = 4x - 4x^2$$
It seems like a pretty ordinary equation, nothing much to get excited about. Here is its graph:
Now use your calculator to plug in some numbers. Start with a value for x, say x=0.2, apply your equation and get y=0.64.
Now try again, this time using this new value for x: plug in x=0.64 and get y=0.9216.
Go again, with the new value x=0.9216 and get y=0.28901376.
Carry on repeating this process (called iterating) for as long as takes your fancy, and you'll get a sequence of numbers:
0.2, 0.64, 0.9216, 0.28901376, 0.8219392261, 0.5854205387, 0.9708133262, ...
What do you think would have happened if you'd started this process with value of 0.2001 for x rather than 0.2? Those two numbers are very close, almost the same, so you would think they'd produce a fairly similar sequence of numbers...
You might like to try it for yourself, perhaps using a spreadsheet, before reading on.
Here is what happens for the two different starting values, plotted out in blue for the sequence of numbers when you start with x=0.2 and red for the sequence that started with x=0.2001:
For the first 8 or so times you plug the numbers back into the equation, you get a fairly similar sequence of numbers - it's very hard to distinguish between the red and blue lines in the chart for those 8 values. Then you begin to see the two lines diverging, and by the 12th iteration, they are wildly out of kilter with each other! Are you surprised that just a small difference in the starting value results in wildly different behaviour in just a few steps?
This behaviour was first encountered by mathematician Edward Lorenz in 1961 when he reran a computer simulation for forecasting the weather. The first time the simulation ran, it started with an initial value of 0.506127, but the second time Lorenz typed in the number by hand and rounded the number to 0.506. No one at the time would have thought such a slight difference would have an impact. But Lorenz was surprised to discover it led to very different forecasts.
Lorenz poetically describing this behaviour as “two weather situations differing by as little as the immediate influence of a single butterfly will generally after sufficient time evolve into two situations differing by as much as the presence of a tornado”.
We now call this sensitivity to initial conditions the butterfly effect and it is one of the hallmarks of mathematical chaos. One of the most surprising things about chaos theory is that it can emerge from such simple equations, such as our example above, as well as from the complex mathematics that is used in weather forecasting, predicting the stock market, and understanding social trends.
You can read more about chaos and Jurassic Park on Plus!