Skip over navigation
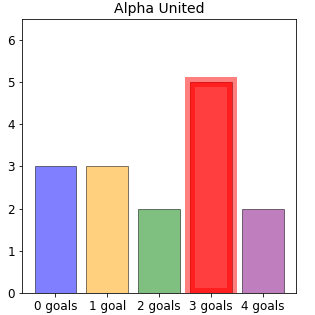
The mode is the most common number of goals scored per match.
On the bar chart, this will be the tallest bar:

Mode number of goals = 3
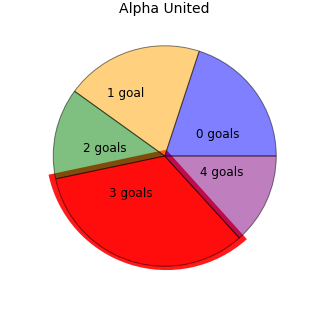
The mode is the most common number of goals scored per match.
On the pie chart, this will be the 'fattest' wedge:

Mode number of goals = 3
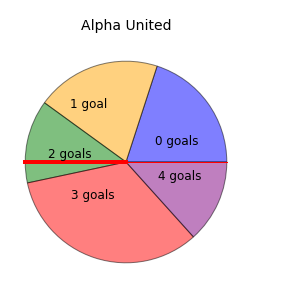
The median is the middle value, when the data are in order.
The pie charts begin from 0 goals, and the number of goals increases in an anticlockwise direction, so the pie charts show the data in order.
After 180$^\circ$, the middle value is reached, so the wedge that the 180$^\circ$ line lands in is the median.

Median number of goals = 2
Working out the median from the bar charts
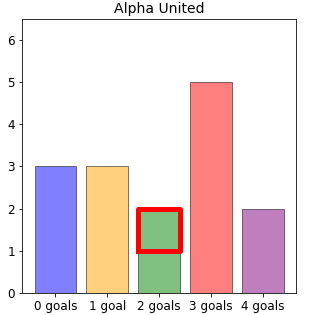
The median is the middle value, when the data is in order. Alpha United played 15 matches, so the middle match is the 8th-lowest-scoring match (which is also the 8th-highest-scoring match), since 7 + 1 + 7 = 15.
So to find the median, we need to find the 8th lowest-scoring match on the bar chart.
 Alpha United scored 0 goals in 3 matches, so those are matches number 1, 2, 3.
They scored 1 goal per match in 3 matches, so those are matches 4, 5 and 6.
They scored 2 goals per match in 2 matches, so those are matches 7 and 8.
So they scored 2 goals in their 8th-lowest-scoring match, so the median is 2.
We can check this, because they scored 3 goals per match in 5 matches and 4 goals per match in 2 matches. 5 + 2 = 7. So they scored more than 2 goals in 7 matches, so the 8th-lowest-scoring match is also the 8th-highest-scoring match.


Or search by topic
Number and algebra
Geometry and measure
Probability and statistics
Working mathematically
Advanced mathematics
For younger learners
Alpha United
Age 11 to 14
ShortChallenge Level 


- Problem
- Solutions
The mode is the most common number of goals scored per match.
On the bar chart, this will be the tallest bar:

Mode number of goals = 3
The mode is the most common number of goals scored per match.
On the pie chart, this will be the 'fattest' wedge:

Mode number of goals = 3
The median is the middle value, when the data are in order.
The pie charts begin from 0 goals, and the number of goals increases in an anticlockwise direction, so the pie charts show the data in order.
After 180$^\circ$, the middle value is reached, so the wedge that the 180$^\circ$ line lands in is the median.

Median number of goals = 2
Working out the median from the bar charts
The median is the middle value, when the data is in order. Alpha United played 15 matches, so the middle match is the 8th-lowest-scoring match (which is also the 8th-highest-scoring match), since 7 + 1 + 7 = 15.
So to find the median, we need to find the 8th lowest-scoring match on the bar chart.
 Alpha United scored 0 goals in 3 matches, so those are matches number 1, 2, 3.
They scored 1 goal per match in 3 matches, so those are matches 4, 5 and 6.
They scored 2 goals per match in 2 matches, so those are matches 7 and 8.
So they scored 2 goals in their 8th-lowest-scoring match, so the median is 2.
We can check this, because they scored 3 goals per match in 5 matches and 4 goals per match in 2 matches. 5 + 2 = 7. So they scored more than 2 goals in 7 matches, so the 8th-lowest-scoring match is also the 8th-highest-scoring match.
You can find more short problems, arranged by curriculum topic, in our short problems collection.
You may also like
Consecutive Numbers
An investigation involving adding and subtracting sets of consecutive numbers. Lots to find out, lots to explore.
Days and Dates
Investigate how you can work out what day of the week your birthday will be on next year, and the year after...

