Take Your Dog for a Walk


Take Your Dog for a Walk
Each day Pat takes the dog for a walk.
You can see them on the interactivity below.
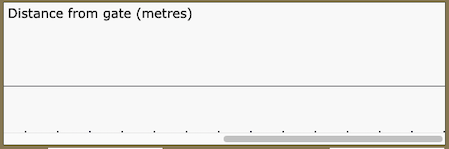
Try moving Pat and the dog using the purple arrow keys. The graph shows how far Pat is walking from the gate after a certain amount of time.
What happens to the graph once Pat gets back to the gate?
Try to reproduce these graphs:
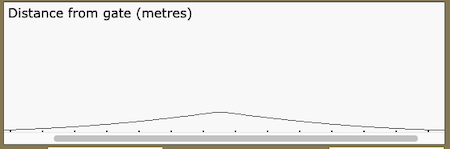
Can you tell a story that would result in each of the graphs above?
Why do this problem?
The idea of this problem is to introduce learners to interpreting distance/time graphs. It lends itself to a trial and improvement approach, which can be an undervalued way of approaching a challenge.
Possible approach
(If possible, it would be great to introduce the class to these ideas using a sensor, which gives an output on a distance/time graph by recording how far an object is from the sensor. However, this is not necessary.)
It is important to allow the class plenty of time to explore what the interactivity does, ideally using a laptop or tablet shared one between two.
After some open exploration time, bring everyone back together. Invite pairs to share any discoveries they have made so far, or anything they have noticed, or any questions they have.
If it has not already come up, you can ask what happens to the graph once Mike gets back to his house after the walk. Why is that the case? You could then display the graphs and ask the class to try to reproduce them. It may be appropriate to invite pupils to try and replicate the first graph on the interactive whiteboard so that everyone can see. Discussing the properties of this first
graph all together will help the children to continue the problem for themselves.
Key questions
How would you describe the shape of the graph?
Possible support
Being able to use the interactivity will mean that pupils can try out their ideas without worrying about getting it 'right' first time.
Possible extension
Can Pat create the same graph with different walks? Can learners describe what they can change and what has to stay the same?
You may also like
Great Squares
Investigate how this pattern of squares continues. You could measure lengths, areas and angles.
Watch the Clock
During the third hour after midnight the hands on a clock point in the same direction (so one hand is over the top of the other). At what time, to the nearest second, does this happen?
Walk and Ride
How far have these students walked by the time the teacher's car reaches them after their bus broke down?