Skip over navigation
Cambridge University Faculty of Mathematics NRich logo
menu search
  • Teachers expand_more
    • Early years
    • Primary
    • Secondary
    • Post-16
    • Events
    • Professional development
  • Students expand_more
    • Primary
    • Secondary
    • Post-16
  • Parents expand_more
    • Early Years
    • Primary
    • Secondary
    • Post-16
  • Problem-Solving Schools
  • About NRICH expand_more
    • About us
    • Impact stories
    • Support us
    • Our funders
    • Contact us
  • search

Or search by topic

Number and algebra

  • The Number System and Place Value
  • Calculations and Numerical Methods
  • Fractions, Decimals, Percentages, Ratio and Proportion
  • Properties of Numbers
  • Patterns, Sequences and Structure
  • Algebraic expressions, equations and formulae
  • Coordinates, Functions and Graphs

Geometry and measure

  • Angles, Polygons, and Geometrical Proof
  • 3D Geometry, Shape and Space
  • Measuring and calculating with units
  • Transformations and constructions
  • Pythagoras and Trigonometry
  • Vectors and Matrices

Probability and statistics

  • Handling, Processing and Representing Data
  • Probability

Working mathematically

  • Thinking mathematically
  • Developing positive attitudes
  • Cross-curricular contexts

Advanced mathematics

  • Decision Mathematics and Combinatorics
  • Advanced Probability and Statistics
  • Mechanics
  • Calculus

For younger learners

  • Early Years Foundation Stage

How Far Does it Move?

Age 11 to 14
Challenge Level Yellow star
Secondary curriculum
  • Problem
  • Getting Started
  • Student Solutions
  • Teachers' Resources

How Far Does it Move? printable sheet


Take a look at the interactivity below which shows regular polygons "rolling" along the horizontal surface.
It leaves a trace of the path of the dot and on the graph it records the distance that the dot travels.

Experiment by positioning the dot at the centre of the polygons, at one of the vertices or at the centre of one of the sides of the polygons and explore how this affects the distance / time graph.

Challenge:

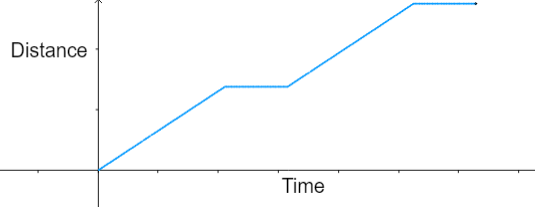
Can you now work out what produced the following distance / time graph?
Can you work out how many sides the polygon had and where the dot was placed?
Try to explain how you worked it out.

Distance Time Graph

Related Collections

  • Functions and Graphs - Stage 3

You may also like

Walk and Ride

How far have these students walked by the time the teacher's car reaches them after their bus broke down?

Rolling Around

A circle rolls around the outside edge of a square so that its circumference always touches the edge of the square. Can you describe the locus of the centre of the circle?

N Is a Number

N people visit their friends staying N kilometres along the coast. Some walk along the cliff path at N km an hour, the rest go by car. How long is the road?

  • Tech help
  • Accessibility Statement
  • Sign up to our newsletter
  • Twitter X logo

The NRICH Project aims to enrich the mathematical experiences of all learners. To support this aim, members of the NRICH team work in a wide range of capacities, including providing professional development for teachers wishing to embed rich mathematical tasks into everyday classroom practice.

NRICH is part of the family of activities in the Millennium Mathematics Project.

University of Cambridge logo NRICH logo