Or search by topic
Number and algebra
Geometry and measure
Probability and statistics
Working mathematically
Advanced mathematics
For younger learners
Published 2011 Revised 2017
Enriching Data Handling
Data handling is one of the central activities in which real mathematicians engage: they are frequently analysing data that they have gathered in various contexts and looking for patterns and generalities within them. In schools we often undertake tasks in which we encourage children to collect data about themselves and their friends but the emphasis tends to be on presenting data in a variety of
forms such as bar charts or pictograms. Analysis is often confined to identifying the most popular or least popular item. These limitations tend to restrict the interest and variety of the contexts that are explored, and fail to engage children in any significant mathematical thinking. Here are some alternative suggestions taken from the NRICH website that offer a broader view of data and ask
some tricky questions about it.
Let us start with a simple question which would be suitable for a group of children to tackle at Stage 1: Ladybird Count .

This question offers children some raw data that they have not had to collect themselves. This has some advantages: the teacher knows that everyone has the same information without worrying about the accuracy of their recording methods. So, we have a data handling problem that focuses on analysis rather than collection. Now the children need to begin to make sense of the situation. It is probably
helpful to ask them to think about the pictures and to talk to each other about what the problem means. Offer them plenty of opportunities to think without insisting on quick answers. After they have had this chance, find out their ideas and, if need be, they can be encouraged to focus by asking them:
"How many ladybirds does each child have?"
From this point the question concentrates on how the data could be represented to show how many ladybirds the different children have. Be prepared to consider a variety of responses: the solutions do not need to be bar charts or pictograms. Their suggestions will provide insight into the children's own methods of recording. Engaging in conversation with them about their representation may be
essential and is a great way to probe their previous experiences of handling and recording data. On the website we post children's solutions to our problems and we received an interesting mindmap from one pupil as a way of representing the data.
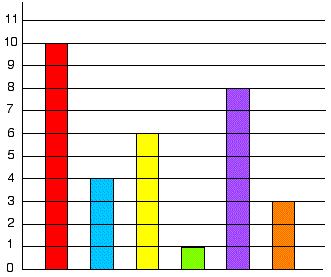
The Pet Graph is a question that has the representation of the data done already.

This time the question is asking the children to work out how the graph should be labelled. This type of task is often regarded as being trivial by teachers and yet it involves crucial aspects of data handling.
To be successful pupils need to understand what the graph is saying and relating that to the information they have been given. This requires high level thinking, especially if you ask your pupils to justify what they have done by asking questions such as:
"How do you know that ...?"
"Why can't the yellow bar represent ...?"
"Which bar was the easiest to identify and why?"
Later on in secondary school children often leave out the labels on axes, rendering the representation meaningless. This question would help children to realise the significance of the labels. It also involves working with unknown quantities that are the precursor to algebra. Once again the key approach involves discussion and thought, and children should be encouraged to think about the question
and talk about it in pairs before a class discussion.
Slow Coach is another question with very different data, not statistical this time, and appropriate for use with children at Stage 2.

Timetables are tricky things and they sometimes need careful thinking to make sense of them. As adults we often forget how many conventions are involved in their presentation and we need to help children to unpack the meanings in them. Once again the role of thinking quietly and discussing the meanings in pairs before voicing suggestions to a wider audience is vital. The teacher may find it
helpful to ask children about what is going on and how they might represent the information in different ways. How about some pictures of the buses on the road from A to B? At 0600 there are just two buses starting off but what about at 0620, 0640, 0700 and so on? What understanding do the children have of the representations of time on the 24 hour clock? The hint to the problems suggests that the children should:
"Draw a diagram of all the coaches on the road when this one sets off."
Once again there is a solution from children posted on the website and they have explained their reasoning as well as given the answer:
"The 10am coach will see the 8.40, 9.00, 9.20, 9.40, 10, 10.20, 10.40, 11, 11.20 coaches on its way to Betaville. Therefore it sees 9 coaches. We know this because they are travelling at the same speed and on the same path."
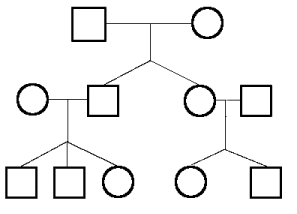
Now for another question in a totally different context appropriate for children at Stage 2. Family Tree is a very challenging problem and should stretch even the highest attainers in the class. At the same time it is an engaging scenario and should provoke some good discussion. This time the data is in the form of
a description.

So what exactly do we need to do? The problem is asking us to fill in the letters of all the family members on the family tree. The clues in the question are sufficient to do so. How could we encourage children to start working on a solution? Once again encouragement to think quietly, make jottings and discuss things with a partner before embarking on class discussion will help to raise the
quality of mathematical thinking and reasoning. One of the pitfalls is the tendency to think of the mathematicians as male which obviously addresses issues of gender stereotyping.
Trying a similar problem with a group of children recently provoked so much enthusiastic participation that they found it hard to wait for a turn to write on the board. The kind of logical reasoning that this requires is central to mathematical thinking and reasoning and yet we tend to offer few opportunities to tackle logical puzzles like this in school mathematics. The data handling involved in
this problem is easy to relate to and the problem-setting engaging. These problems offer interesting contexts in which to explore data handling and there are plenty more on offer on NRICH from football results to codes.
This article first appeared in Maths Coordinator's File issue 19, published by pfp publishing.

