Skip over navigation
Cambridge University Faculty of Mathematics NRich logo
menu search
  • Teachers expand_more
    • Early years
    • Primary
    • Secondary
    • Post-16
    • Events
    • Professional development
  • Students expand_more
    • Primary
    • Secondary
    • Post-16
  • Parents expand_more
    • Early Years
    • Primary
    • Secondary
    • Post-16
  • Problem-Solving Schools
  • About NRICH expand_more
    • About us
    • Impact stories
    • Support us
    • Our funders
    • Contact us
  • search

Or search by topic

Number and algebra

  • The Number System and Place Value
  • Calculations and Numerical Methods
  • Fractions, Decimals, Percentages, Ratio and Proportion
  • Properties of Numbers
  • Patterns, Sequences and Structure
  • Algebraic expressions, equations and formulae
  • Coordinates, Functions and Graphs

Geometry and measure

  • Angles, Polygons, and Geometrical Proof
  • 3D Geometry, Shape and Space
  • Measuring and calculating with units
  • Transformations and constructions
  • Pythagoras and Trigonometry
  • Vectors and Matrices

Probability and statistics

  • Handling, Processing and Representing Data
  • Probability

Working mathematically

  • Thinking mathematically
  • Developing positive attitudes
  • Cross-curricular contexts

Advanced mathematics

  • Decision Mathematics and Combinatorics
  • Advanced Probability and Statistics
  • Mechanics
  • Calculus

For younger learners

  • Early Years Foundation Stage

Into the Exponential Distribution

Age 16 to 18
Challenge Level Yellow star
  • Problem
  • Getting Started
  • Student Solutions
  • Teachers' Resources


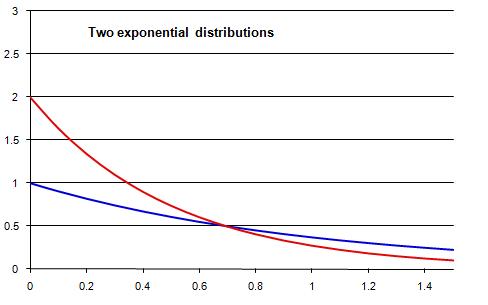
This chart shows the probability density functions for two exponential distributions. Here are some questions to consider concerning these sorts of distributions. You can use a mixture of probability-based reasoning and algebraic reasoning based on the properties of integrals and areas.

1. Which exponential distributions do these curves correspond to? What interesting mathematical properties do they have? Which has the largest mean?
2. Two separate areas are enclosed by the red and blue curves: one to the left of the point of intersection and one to the right. What can you say about the sizes of these two areas? Can you give a good explanation?
3. Can you find the point of intersection of the pdfs? Can you find the area of each of the enclosed parts of the diagrams?
4. From the graphs, I visually estimated that $P(0.5 < Red < 0.7) = 0.125$. Can you work out how I made this estimate? Is it an over-estimate or an underestimate? How close do you think that estimate is to the correct answer? Work out the correct answer to find out.
5. Try to make, assess and check your own estimates similar to that in question 4.


You may also like

PDF

Given a probability density function find the mean, median and mode of the distribution.

Scale Invariance

By exploring the concept of scale invariance, find the probability that a random piece of real data begins with a 1.

PCDF

When can a pdf and a cdf coincide?

  • Tech help
  • Accessibility Statement
  • Sign up to our newsletter
  • Twitter X logo

The NRICH Project aims to enrich the mathematical experiences of all learners. To support this aim, members of the NRICH team work in a wide range of capacities, including providing professional development for teachers wishing to embed rich mathematical tasks into everyday classroom practice.

NRICH is part of the family of activities in the Millennium Mathematics Project.

University of Cambridge logo NRICH logo