Skip over navigation


The initial key to this problem is to realise that for self-dissociating water, [H]$^+$ = [OH]$^-$.
Therefore, K$_W = [H^+]^2$
Since pH = $-log_{10}[H^+]$
$\mathbf{\Rightarrow K_W = 10^{-2pH}}$
When pH = 7; $K_W = 1 \times 10^{-14}$
pH =6.8; $K_W = 2.51 \times 10^{-14}$
pH = 7.2; $K_W = 0.398 \times 10^{-14}$
Plotting a graph of $K_W$ versus temperature gives:
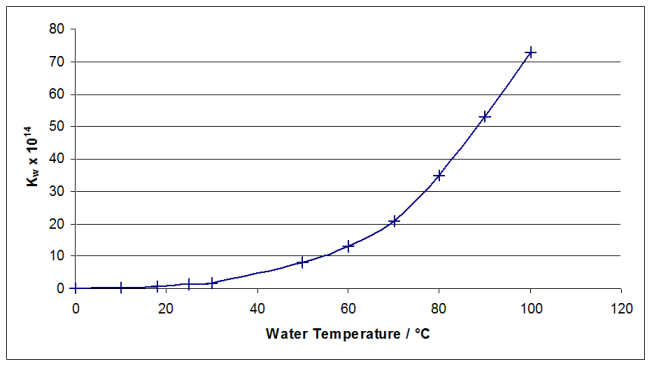
By drawing a smooth curve of best fit through the points, the relevant temperatures can be read off the graph for the given values of $K_W$. If you draw the graph for the entire temperature range, it is difficult to read off accurate values in the required range, which are all smaller than $10\times 10^{14}$. Plotting the curve through the first three points allows us to read off accurate values.
pH Temperature
Age 16 to 18
Challenge Level 

The initial key to this problem is to realise that for self-dissociating water, [H]$^+$ = [OH]$^-$.
Therefore, K$_W = [H^+]^2$
Since pH = $-log_{10}[H^+]$
$\mathbf{\Rightarrow K_W = 10^{-2pH}}$
When pH = 7; $K_W = 1 \times 10^{-14}$
pH =6.8; $K_W = 2.51 \times 10^{-14}$
pH = 7.2; $K_W = 0.398 \times 10^{-14}$
Plotting a graph of $K_W$ versus temperature gives:
By drawing a smooth curve of best fit through the points, the relevant temperatures can be read off the graph for the given values of $K_W$. If you draw the graph for the entire temperature range, it is difficult to read off accurate values in the required range, which are all smaller than $10\times 10^{14}$. Plotting the curve through the first three points allows us to read off accurate values.
You may also like
A Method of Defining Coefficients in the Equations of Chemical Reactions
A simple method of defining the coefficients in the equations of chemical reactions with the help of a system of linear algebraic equations.
Mathematical Issues for Chemists
A brief outline of the mathematical issues faced by chemistry students.
Reaction Rates
Explore the possibilities for reaction rates versus concentrations with this non-linear differential equation