Skip over navigation
Cambridge University Faculty of Mathematics NRich logo
menu search
  • Teachers expand_more
    • Early years
    • Primary
    • Secondary
    • Post-16
    • Events
    • Professional development
  • Students expand_more
    • Primary
    • Secondary
    • Post-16
  • Parents expand_more
    • Early Years
    • Primary
    • Secondary
    • Post-16
  • Problem-Solving Schools
  • About NRICH expand_more
    • About us
    • Impact stories
    • Support us
    • Our funders
    • Contact us
  • search

Or search by topic

Number and algebra

  • The Number System and Place Value
  • Calculations and Numerical Methods
  • Fractions, Decimals, Percentages, Ratio and Proportion
  • Properties of Numbers
  • Patterns, Sequences and Structure
  • Algebraic expressions, equations and formulae
  • Coordinates, Functions and Graphs

Geometry and measure

  • Angles, Polygons, and Geometrical Proof
  • 3D Geometry, Shape and Space
  • Measuring and calculating with units
  • Transformations and constructions
  • Pythagoras and Trigonometry
  • Vectors and Matrices

Probability and statistics

  • Handling, Processing and Representing Data
  • Probability

Working mathematically

  • Thinking mathematically
  • Developing positive attitudes
  • Cross-curricular contexts

Advanced mathematics

  • Decision Mathematics and Combinatorics
  • Advanced Probability and Statistics
  • Mechanics
  • Calculus

For younger learners

  • Early Years Foundation Stage

Equation Matcher

Age 16 to 18
Challenge Level Yellow star
  • Problem
  • Teachers' Resources

Fitting algebraic curves through experimental data points is an important scientific process which allows us to make predictions of the behaviour of a system away from the observed points. But which equations are sensible choices for a particular set of data? This question draws us into the general process of curve fitting.

In four different sorts of experiments, two values of $x$ and $y$ are successively measured and plotted on charts below:


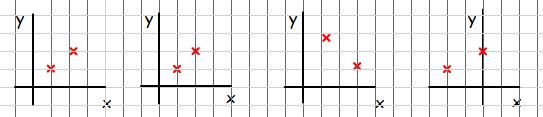
For each chart, which of the following equations are possible descriptions of the underlying process?
$$y = ax+b\quad\quad x = ay + \frac{1}{2} by^2\quad\quad y=\frac{a}{x}$$
$$x=a e^{by}\quad\quad x = \frac{ay}{b+y}\quad\quad x = -a\log_{10}(by)$$
What restrictions would the data place on the ranges of the numbers $a$ and $b$ in each case? For example, do the data points imply that the constants will be positive?

Another point is subsequently measured and plotted on the graphs in each case.


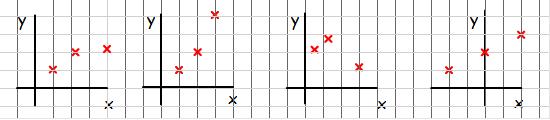
How do the possibilities now change?

Can you give examples of physical systems which are modelled by equations of these types?

Extension: Which curves can be distinguished by three points? i. e., could you pick three points which would rule out all but one of the possibilities in each case?


You may also like

Guess the Function

This task depends on learners sharing reasoning, listening to opinions, reflecting and pulling ideas together.

  • Tech help
  • Accessibility Statement
  • Sign up to our newsletter
  • Twitter X logo

The NRICH Project aims to enrich the mathematical experiences of all learners. To support this aim, members of the NRICH team work in a wide range of capacities, including providing professional development for teachers wishing to embed rich mathematical tasks into everyday classroom practice.

NRICH is part of the family of activities in the Millennium Mathematics Project.

University of Cambridge logo NRICH logo