Skip over navigation
Cambridge University Faculty of Mathematics NRich logo
menu search
  • Teachers expand_more
    • Early years
    • Primary
    • Secondary
    • Post-16
    • Events
    • Professional development
  • Students expand_more
    • Primary
    • Secondary
    • Post-16
  • Parents expand_more
    • Early Years
    • Primary
    • Secondary
    • Post-16
  • Problem-Solving Schools
  • About NRICH expand_more
    • About us
    • Impact stories
    • Support us
    • Our funders
    • Contact us
  • search

Or search by topic

Number and algebra

  • The Number System and Place Value
  • Calculations and Numerical Methods
  • Fractions, Decimals, Percentages, Ratio and Proportion
  • Properties of Numbers
  • Patterns, Sequences and Structure
  • Algebraic expressions, equations and formulae
  • Coordinates, Functions and Graphs

Geometry and measure

  • Angles, Polygons, and Geometrical Proof
  • 3D Geometry, Shape and Space
  • Measuring and calculating with units
  • Transformations and constructions
  • Pythagoras and Trigonometry
  • Vectors and Matrices

Probability and statistics

  • Handling, Processing and Representing Data
  • Probability

Working mathematically

  • Thinking mathematically
  • Developing positive attitudes
  • Cross-curricular contexts

Advanced mathematics

  • Decision Mathematics and Combinatorics
  • Advanced Probability and Statistics
  • Mechanics
  • Calculus

For younger learners

  • Early Years Foundation Stage

Ideal Axes

Age 16 to 18
Challenge Level Yellow star
  • Problem
  • Getting Started
  • Student Solutions

  • Warm-up
  • Try this next
  • Think higher
  • Read: mathematics
  • Read: science
  • Explore further
 

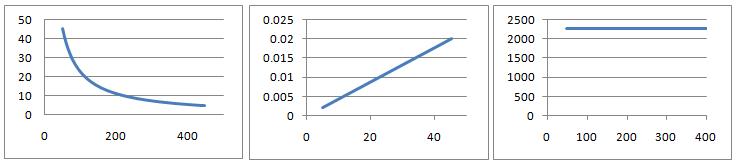
At constant temperature $T$, the gas law $PV=nRT$ is effectively an equation with two variables. Plotting different combinations of the variables $P$ and $V$ as the axes yields the three charts below. Can you deduce the likely variables and units for the axes in each case and the value for $nRT$? What is the likely physical interpretation of this value?


Explore the different possibilities for the shapes of graphs for the following equations by choosing different variables for the axes (you choose values for the constants)

Kinetic theory equations: Plot $PV = \frac{1}{3}mN\bar{c^2}$ for fixed $V$ and variable $P$, $\bar{c^2}$

van der Waals equations: Plot $(P+aV^{-2}_m)(V_m-b)=RT$ for fixed $T$ and variable $P$, $V_m$.

Can each be plotted in a form qualitatively similar to the three charts above? Can they be plotted to yield other forms distinct from the above?

You might wish to use a spreadsheet to allow you to make the various plots quickly, and you may wish to explore other formulas common to science.
 

You may also like

How Many Solutions?

Find all the solutions to the this equation.

Quartics

Investigate the graphs of y = [1 + (x - t)^2][1 + (x + t^)2] as the parameter t varies.

Power Up

Show without recourse to any calculating aid that 7^{1/2} + 7^{1/3} + 7^{1/4} < 7 and 4^{1/2} + 4^{1/3} + 4^{1/4} > 4 . Sketch the graph of f(x) = x^{1/2} + x^{1/3} + x^{1/4} -x

  • Tech help
  • Accessibility Statement
  • Sign up to our newsletter
  • Twitter X logo

The NRICH Project aims to enrich the mathematical experiences of all learners. To support this aim, members of the NRICH team work in a wide range of capacities, including providing professional development for teachers wishing to embed rich mathematical tasks into everyday classroom practice.

NRICH is part of the family of activities in the Millennium Mathematics Project.

University of Cambridge logo NRICH logo