Skip over navigation
Cambridge University Faculty of Mathematics NRich logo
menu search
  • Teachers expand_more
    • Early years
    • Primary
    • Secondary
    • Post-16
    • Events
    • Professional development
  • Students expand_more
    • Primary
    • Secondary
    • Post-16
  • Parents expand_more
    • Early Years
    • Primary
    • Secondary
    • Post-16
  • Problem-Solving Schools
  • About NRICH expand_more
    • About us
    • Impact stories
    • Support us
    • Our funders
    • Contact us
  • search

Or search by topic

Number and algebra

  • The Number System and Place Value
  • Calculations and Numerical Methods
  • Fractions, Decimals, Percentages, Ratio and Proportion
  • Properties of Numbers
  • Patterns, Sequences and Structure
  • Algebraic expressions, equations and formulae
  • Coordinates, Functions and Graphs

Geometry and measure

  • Angles, Polygons, and Geometrical Proof
  • 3D Geometry, Shape and Space
  • Measuring and calculating with units
  • Transformations and constructions
  • Pythagoras and Trigonometry
  • Vectors and Matrices

Probability and statistics

  • Handling, Processing and Representing Data
  • Probability

Working mathematically

  • Thinking mathematically
  • Developing positive attitudes
  • Cross-curricular contexts

Advanced mathematics

  • Decision Mathematics and Combinatorics
  • Advanced Probability and Statistics
  • Mechanics
  • Calculus

For younger learners

  • Early Years Foundation Stage

Fill Me Up

Age 11 to 14
Challenge Level Yellow starYellow star
Secondary curriculum
  • Problem
  • Getting Started
  • Student Solutions
  • Teachers' Resources

Fill Me Up printable sheet
 

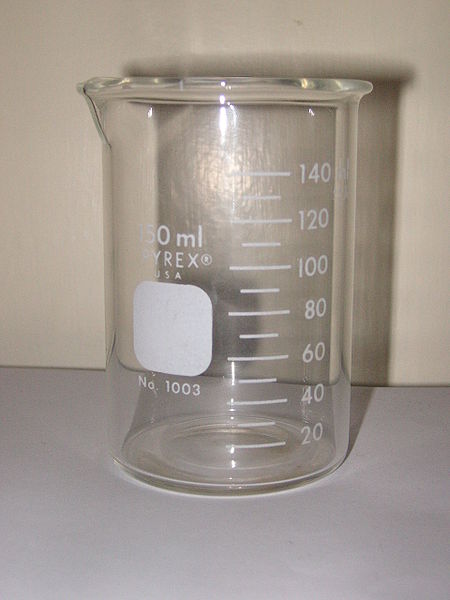
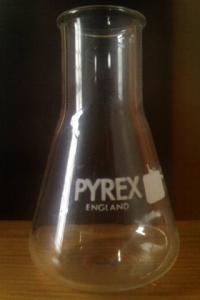
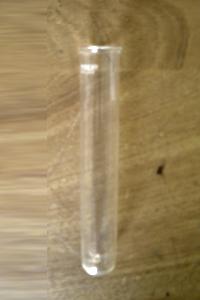
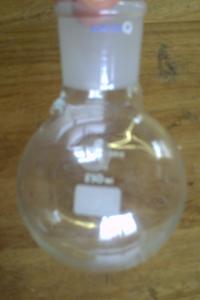
Below are some images of containers. Imagine you put them under a steady stream of water.

What would the graphs look like if you plotted the height of the water level against the volume of water as the containers fill up?

Draw a sketch graph for each container. You will need to consider which portions of each graph will be straight and which will be curved. Can you suggest suitable units and scales for the axes?
 

Beaker


Conical flask


Boiling tube


Round-bottomed flask


Pint glass
 
 
Volumetric flask
 

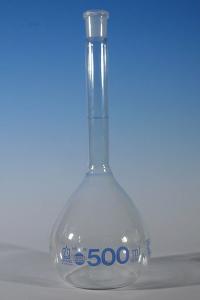
Once you have sketched the graphs, you might like to plot the graphs by collecting some data.
 
One way to do this is to collect suitable containers, add water in fixed amounts and measure the height at each stage. Do your experimental graphs match your sketches?


Pictures
 
http://commons.wikimedia.org/wiki/File:Becher-pyrex-150mL.jpg
http://commons.wikimedia.org/wiki/File:Pyrex_Conical_Flask.jpg
http://commons.wikimedia.org/wiki/File:Pint_glass_300x509.jpg
http://commons.wikimedia.org/wiki/File:Volumetric_flask_hg.jpg
Thanks to Euan Willder for the pictures of the Boiling Tube and Round Bottomed Flask

Related Collections

  • Functions and Graphs - Stage 3

You may also like

Temperature

Is there a temperature at which Celsius and Fahrenheit readings are the same?

Mixing Lemonade

Can you work out which drink has the stronger flavour?

Does This Sound about Right?

Examine these estimates. Do they sound about right?

  • Tech help
  • Accessibility Statement
  • Sign up to our newsletter
  • Twitter X logo

The NRICH Project aims to enrich the mathematical experiences of all learners. To support this aim, members of the NRICH team work in a wide range of capacities, including providing professional development for teachers wishing to embed rich mathematical tasks into everyday classroom practice.

NRICH is part of the family of activities in the Millennium Mathematics Project.

University of Cambridge logo NRICH logo