Skip over navigation
Cambridge University Faculty of Mathematics NRich logo
menu search
  • Teachers expand_more
    • Early years
    • Primary
    • Secondary
    • Post-16
    • Events
    • Professional development
  • Students expand_more
    • Primary
    • Secondary
    • Post-16
  • Parents expand_more
    • Early Years
    • Primary
    • Secondary
    • Post-16
  • Problem-Solving Schools
  • About NRICH expand_more
    • About us
    • Impact stories
    • Support us
    • Our funders
    • Contact us
  • search

Or search by topic

Number and algebra

  • The Number System and Place Value
  • Calculations and Numerical Methods
  • Fractions, Decimals, Percentages, Ratio and Proportion
  • Properties of Numbers
  • Patterns, Sequences and Structure
  • Algebraic expressions, equations and formulae
  • Coordinates, Functions and Graphs

Geometry and measure

  • Angles, Polygons, and Geometrical Proof
  • 3D Geometry, Shape and Space
  • Measuring and calculating with units
  • Transformations and constructions
  • Pythagoras and Trigonometry
  • Vectors and Matrices

Probability and statistics

  • Handling, Processing and Representing Data
  • Probability

Working mathematically

  • Thinking mathematically
  • Developing positive attitudes
  • Cross-curricular contexts

Advanced mathematics

  • Decision Mathematics and Combinatorics
  • Advanced Probability and Statistics
  • Mechanics
  • Calculus

For younger learners

  • Early Years Foundation Stage

Olympic Records

Age 11 to 14
Challenge Level Yellow star
Secondary curriculum
  • Problem
  • Getting Started
  • Student Solutions
  • Teachers' Resources


Olympic Records printable sheet - graphs


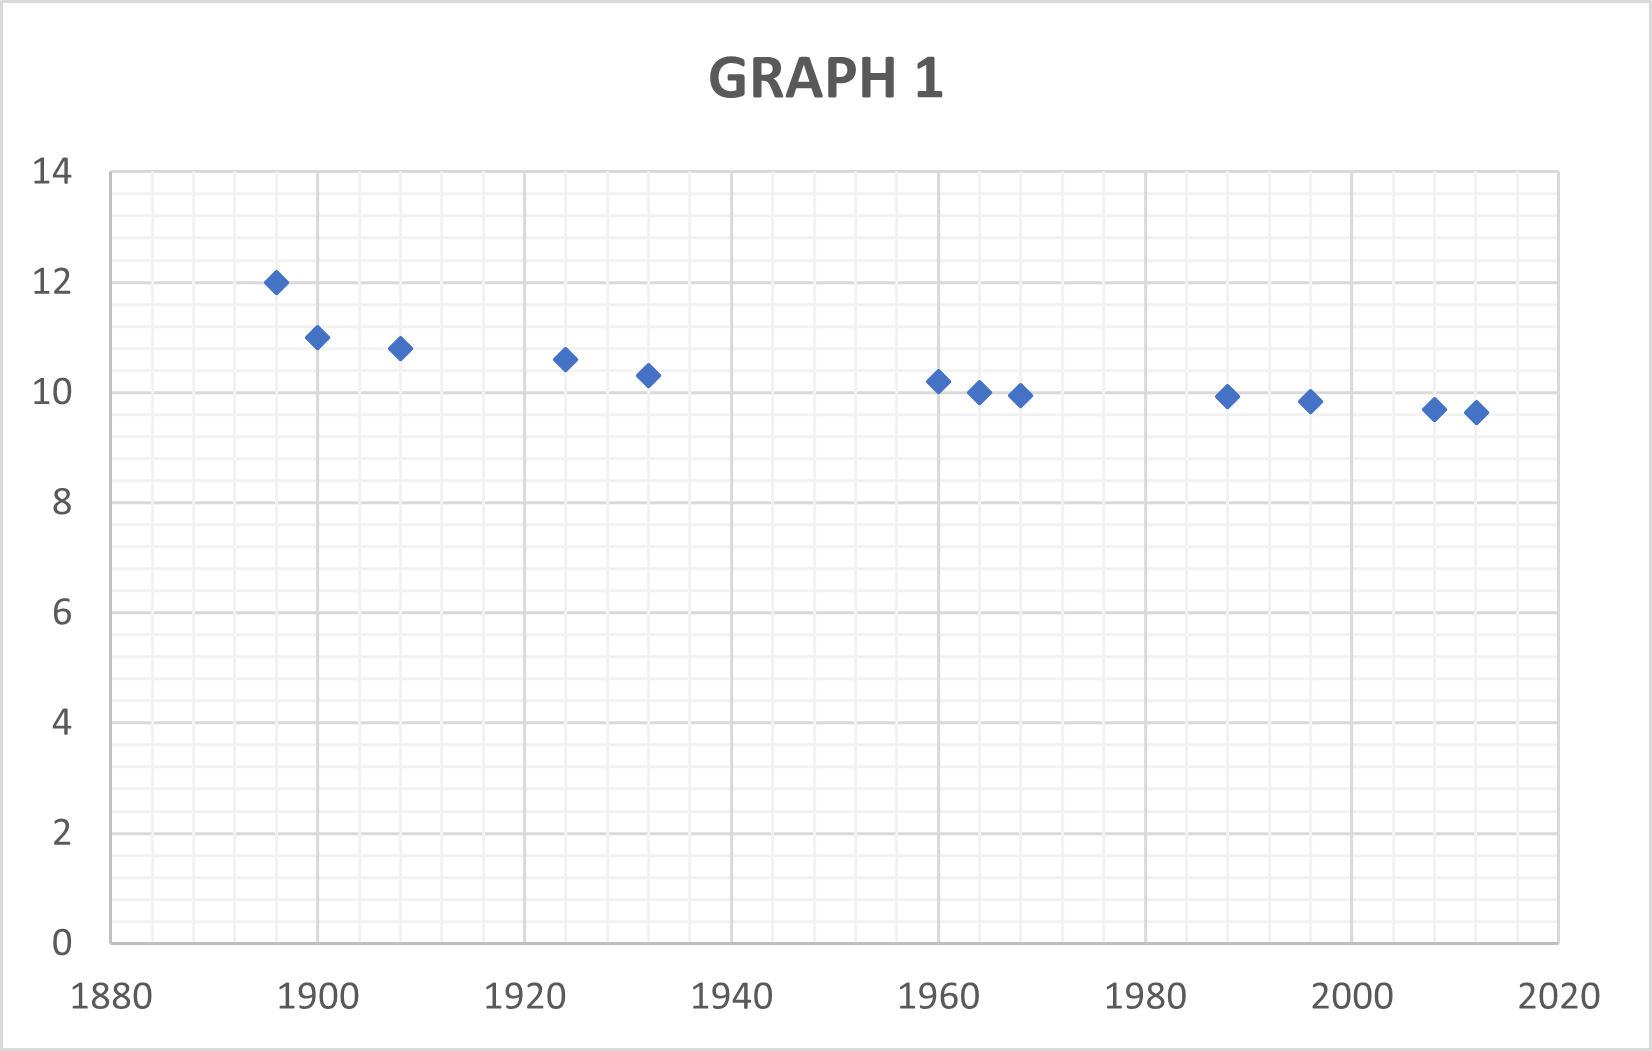
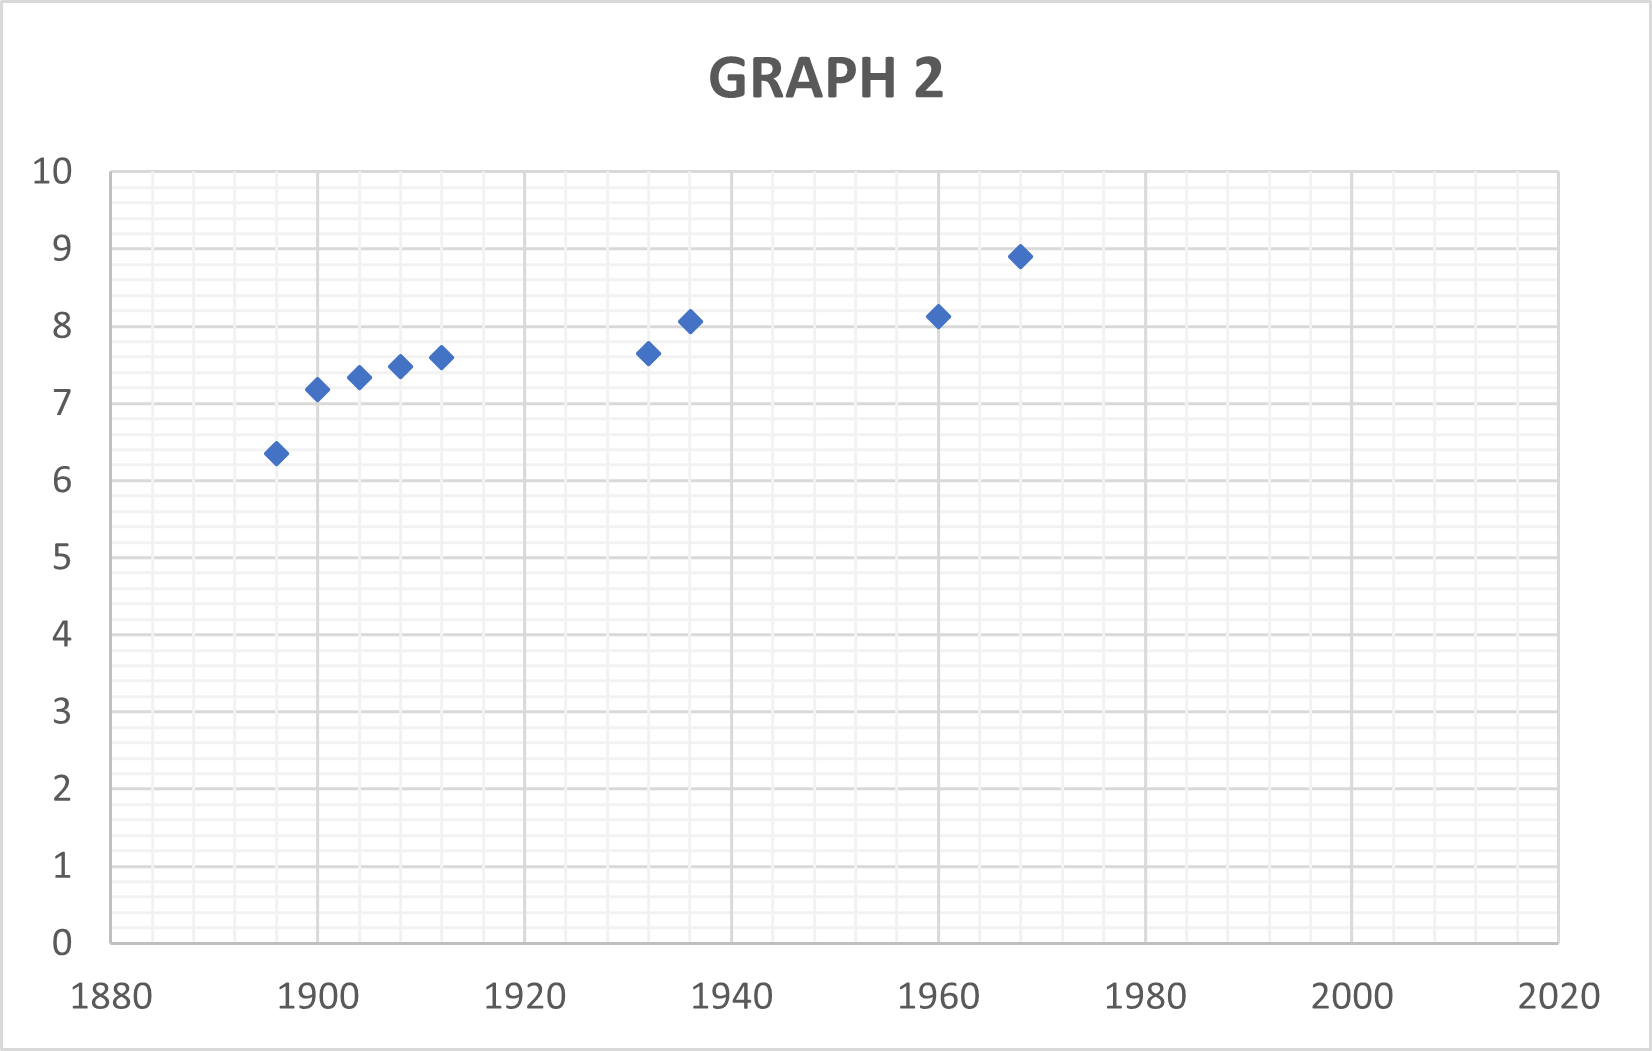
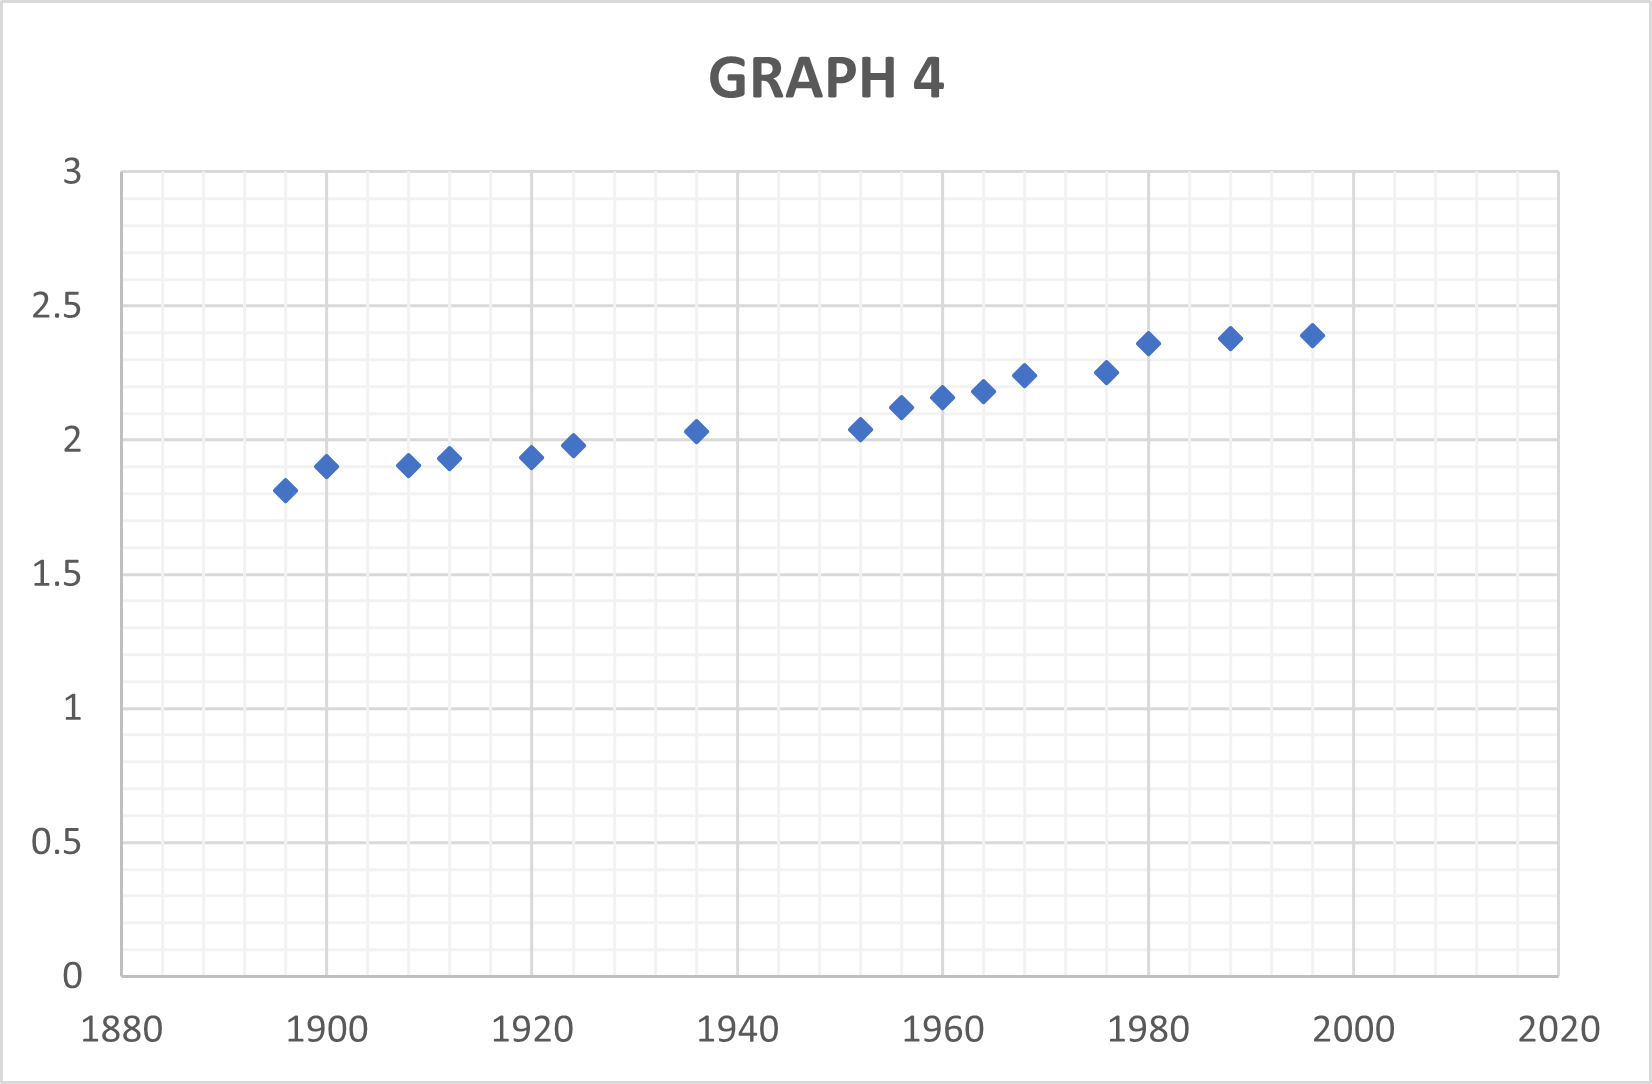
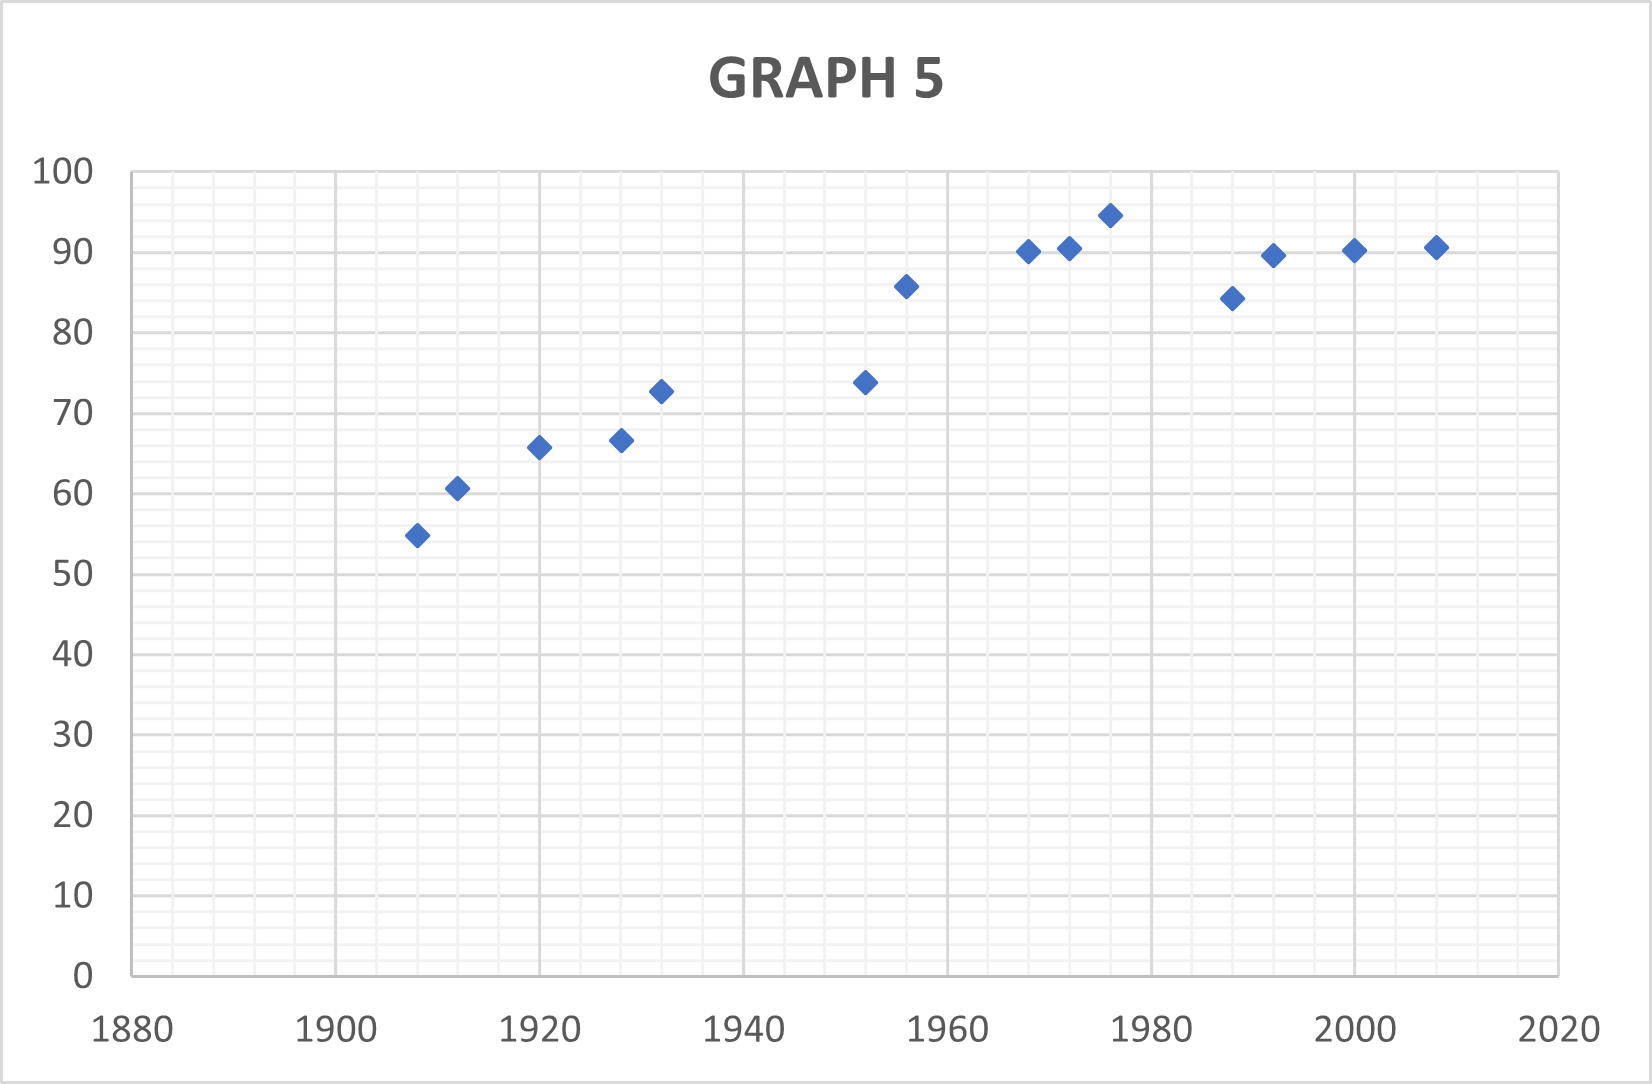
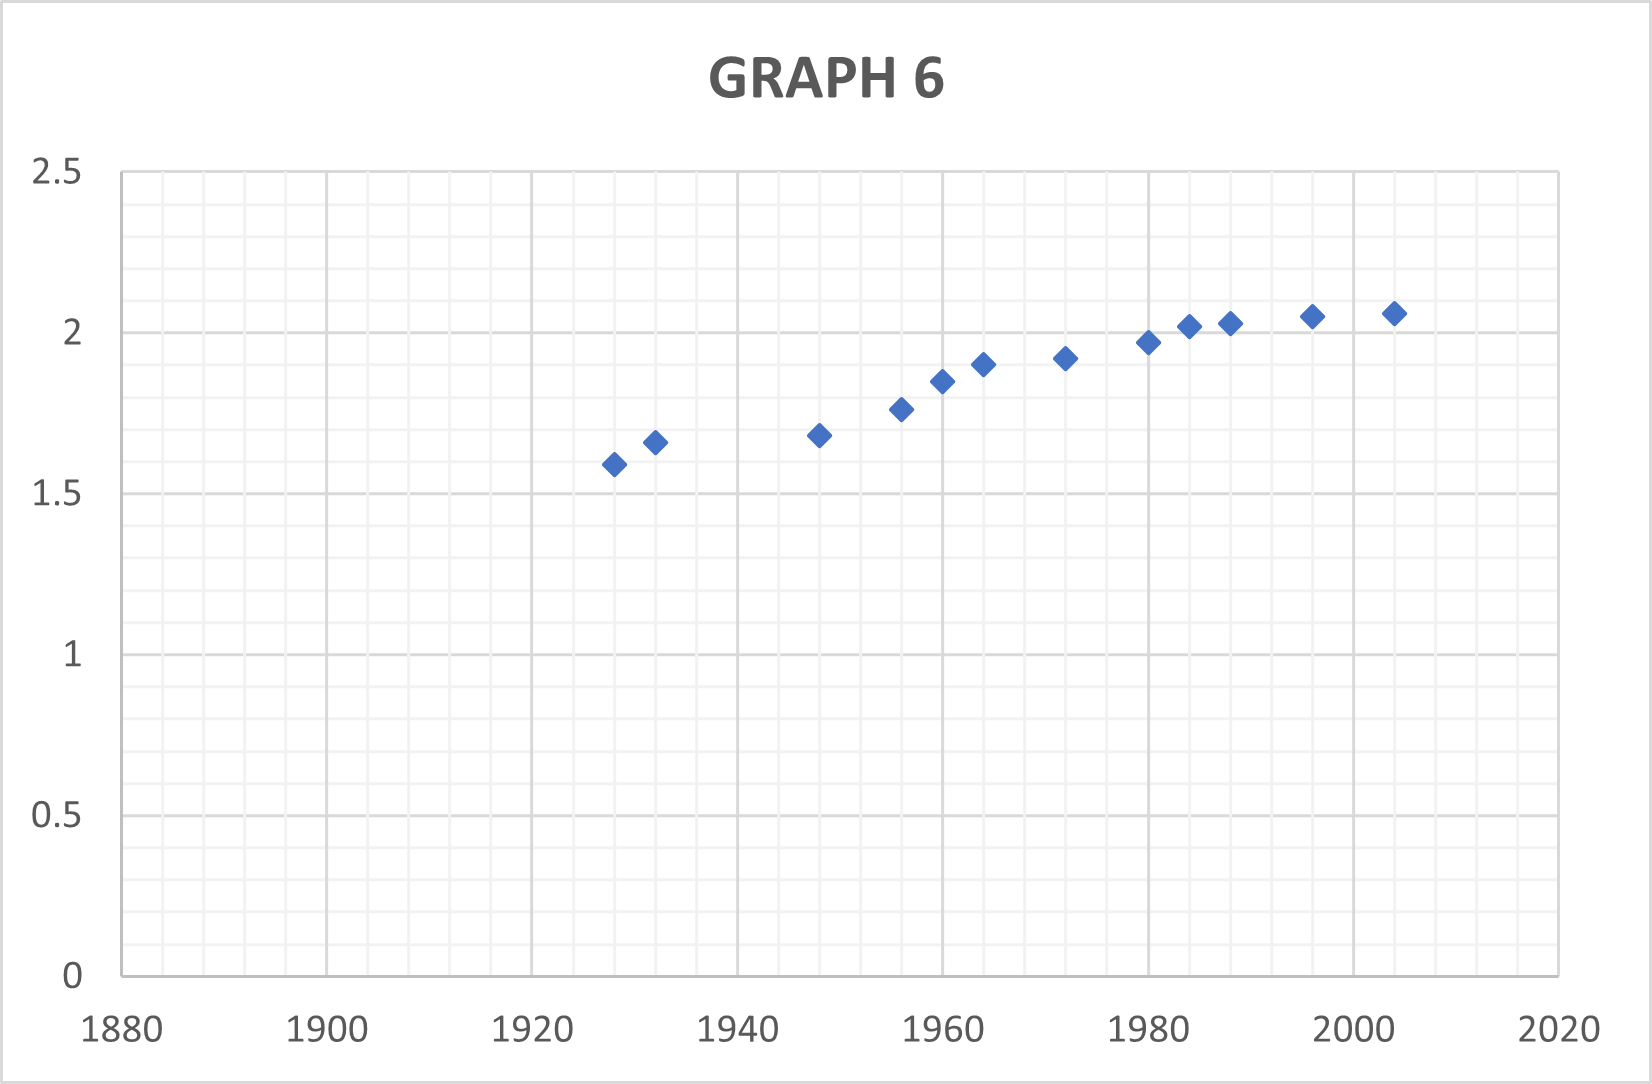
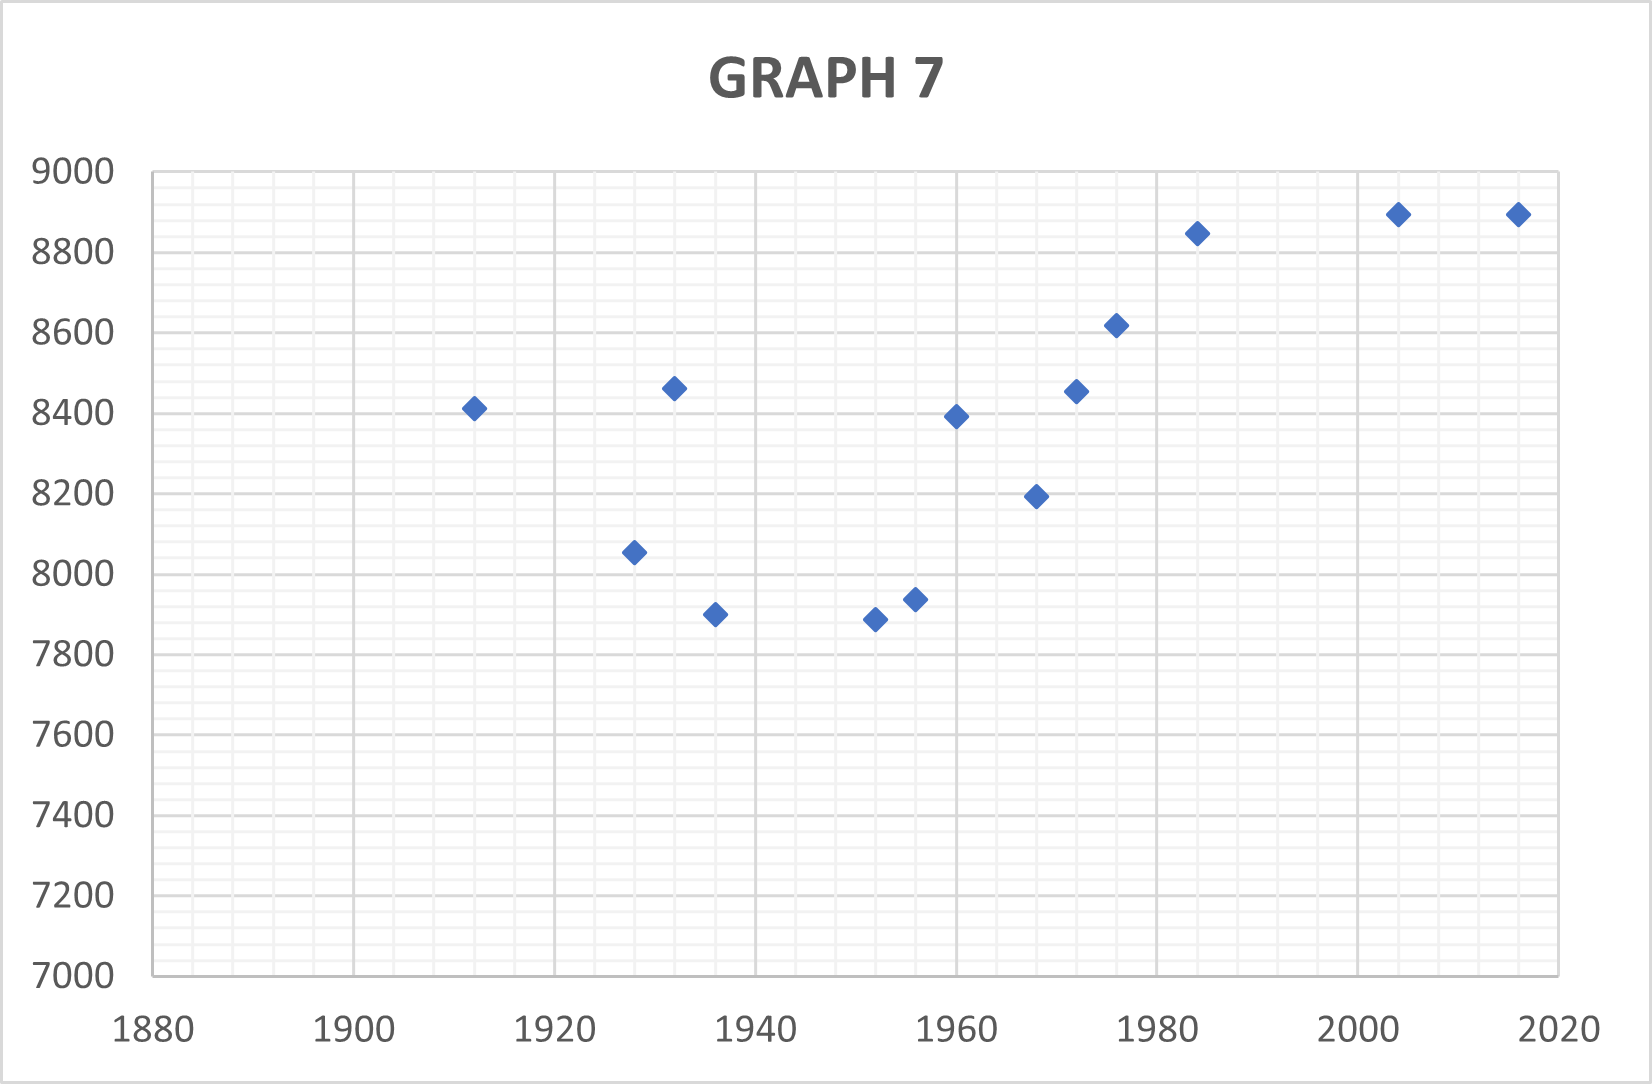
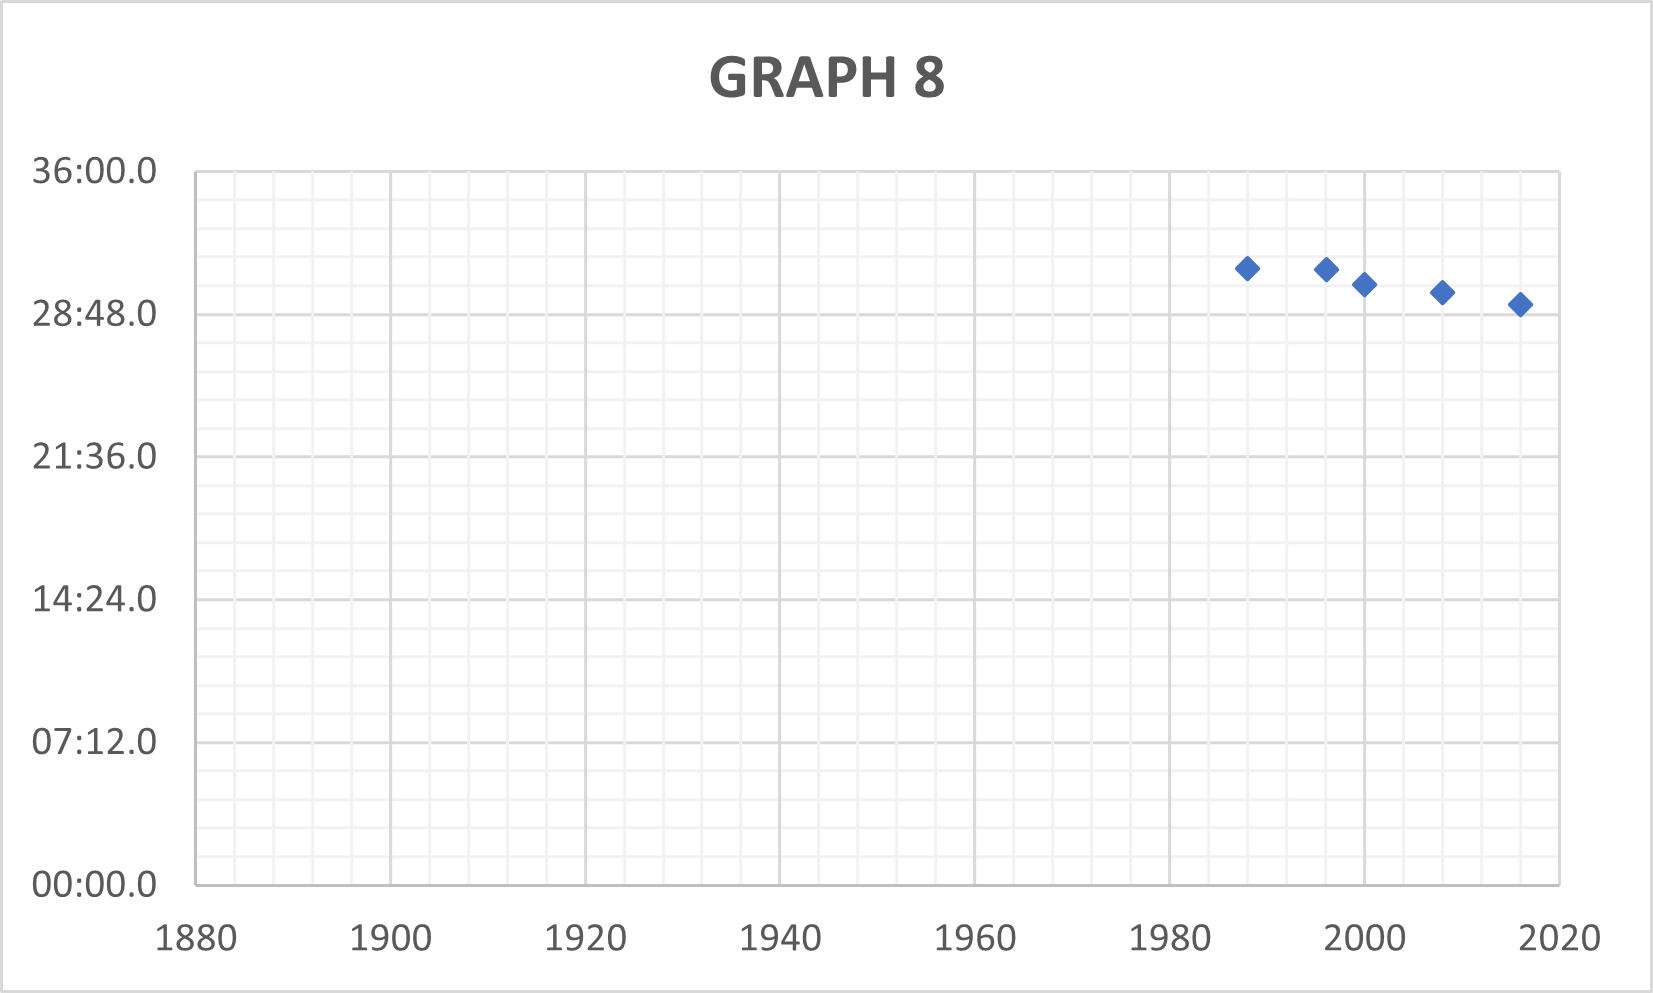
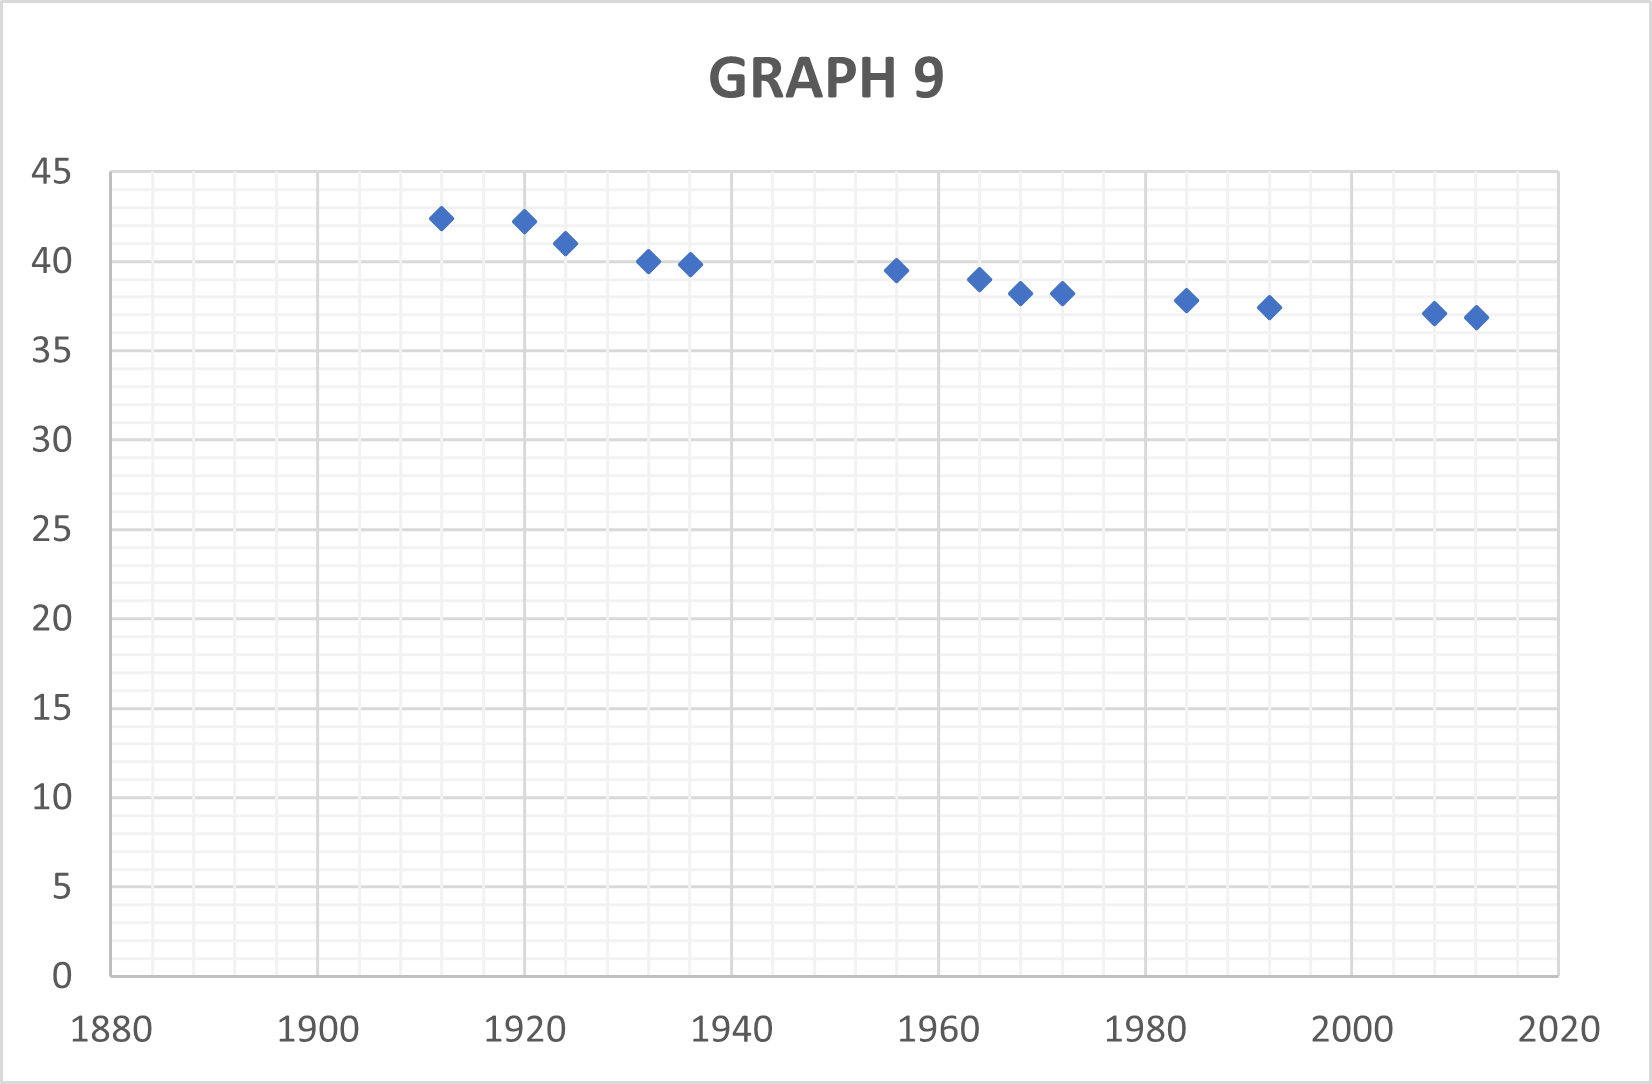
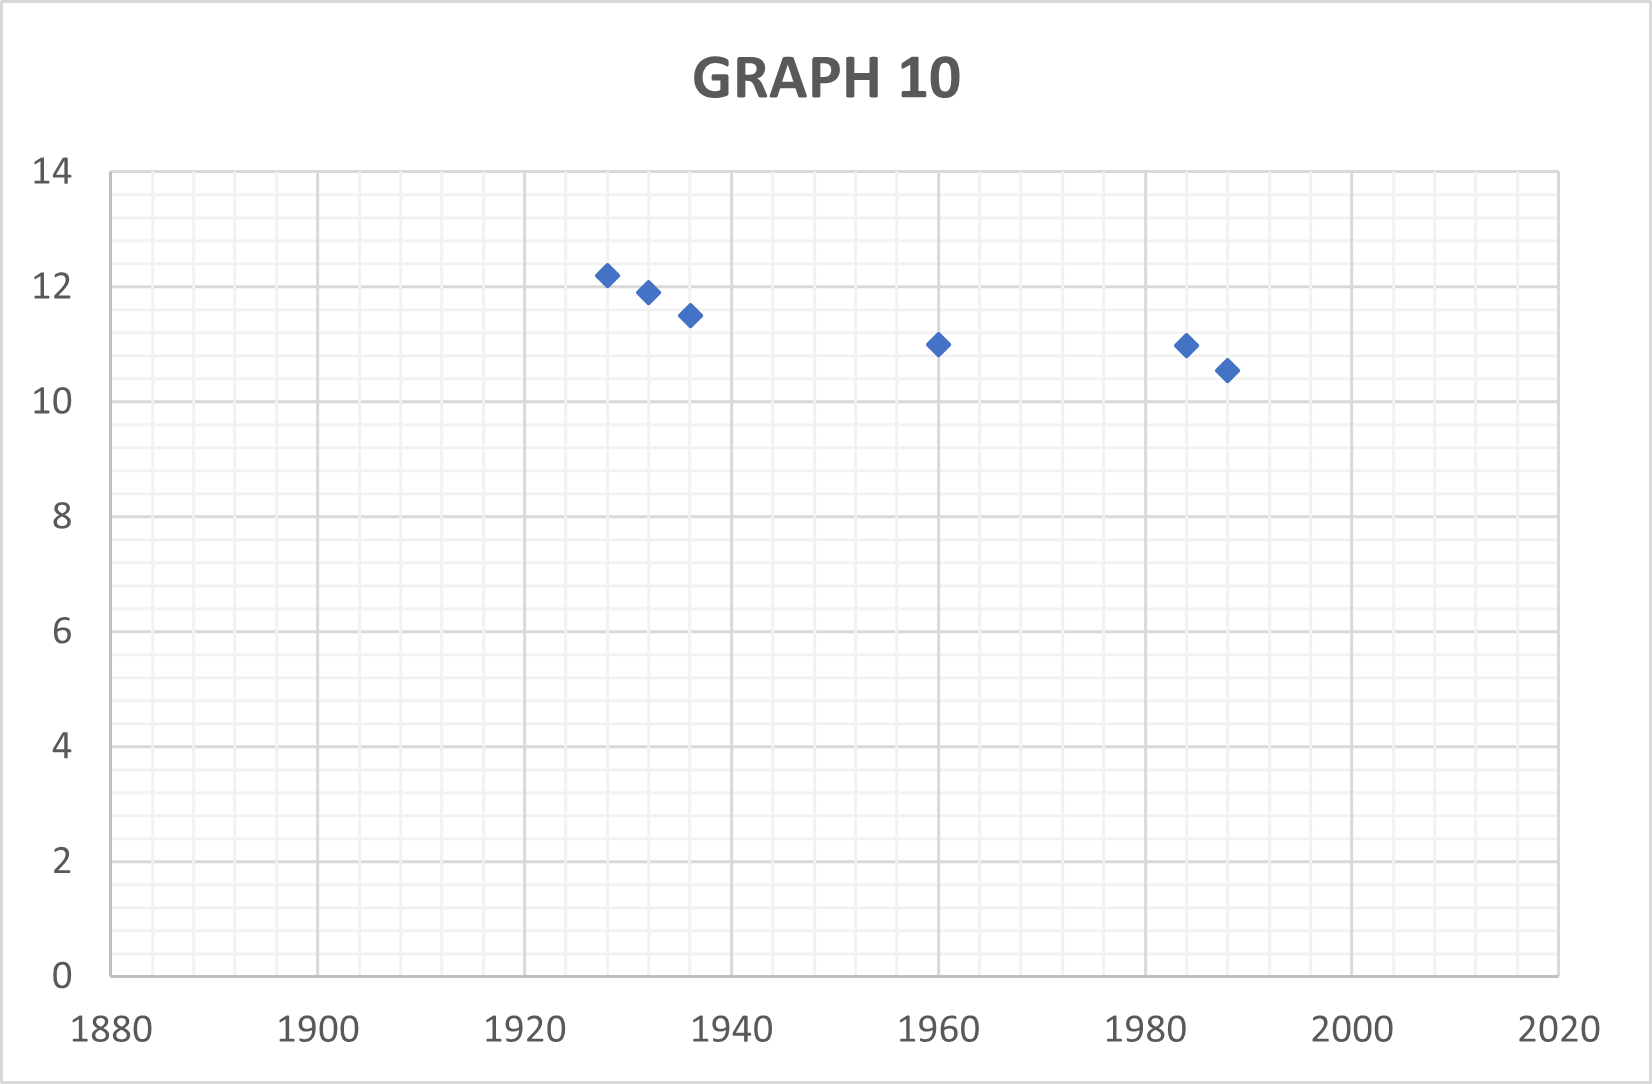
Here are ten graphs showing how Olympic records have changed over time in ten athletic events.

Can you deduce which event each graph represents?

You can click on the thumbnails above to view each graph, or download this pdf or this powerpoint with all the graphs.

Here are some questions to consider, which may help you to make sense of the graphs:

  • Can you determine what the units might be on the vertical axis for each graph?
  • Why do some graphs show a decreasing trend and some an increasing trend?
  • Are there any unusual features in any of the graphs? Can you think of a plausible explanation for them?

Thanks to Alan Parr for suggesting this problem.

Related Collections

You may also like

Calendar Capers

Choose any three by three square of dates on a calendar page...

Winning Team

Nine cross country runners compete in a team competition in which there are three matches. If you were a judge how would you decide who would win?

Not Necessarily in That Order

Baker, Cooper, Jones and Smith are four people whose occupations are teacher, welder, mechanic and programmer, but not necessarily in that order. What is each person’s occupation?

  • Tech help
  • Accessibility Statement
  • Sign up to our newsletter
  • Twitter X logo

The NRICH Project aims to enrich the mathematical experiences of all learners. To support this aim, members of the NRICH team work in a wide range of capacities, including providing professional development for teachers wishing to embed rich mathematical tasks into everyday classroom practice.

NRICH is part of the family of activities in the Millennium Mathematics Project.

University of Cambridge logo NRICH logo