Skip over navigation
Cambridge University Faculty of Mathematics NRich logo
menu search
  • Teachers expand_more
    • Early years
    • Primary
    • Secondary
    • Post-16
    • Events
    • Professional development
  • Students expand_more
    • Primary
    • Secondary
    • Post-16
  • Parents expand_more
    • Early Years
    • Primary
    • Secondary
    • Post-16
  • Problem-Solving Schools
  • About NRICH expand_more
    • About us
    • Impact stories
    • Support us
    • Our funders
    • Contact us
  • search

Or search by topic

Number and algebra

  • The Number System and Place Value
  • Calculations and Numerical Methods
  • Fractions, Decimals, Percentages, Ratio and Proportion
  • Properties of Numbers
  • Patterns, Sequences and Structure
  • Algebraic expressions, equations and formulae
  • Coordinates, Functions and Graphs

Geometry and measure

  • Angles, Polygons, and Geometrical Proof
  • 3D Geometry, Shape and Space
  • Measuring and calculating with units
  • Transformations and constructions
  • Pythagoras and Trigonometry
  • Vectors and Matrices

Probability and statistics

  • Handling, Processing and Representing Data
  • Probability

Working mathematically

  • Thinking mathematically
  • Developing positive attitudes
  • Cross-curricular contexts

Advanced mathematics

  • Decision Mathematics and Combinatorics
  • Advanced Probability and Statistics
  • Mechanics
  • Calculus

For younger learners

  • Early Years Foundation Stage

Birdwatch

Age 7 to 11
Challenge Level Yellow star
Primary curriculum
  • Problem
  • Getting Started
  • Student Solutions
  • Teachers' Resources

Birdwatch

Every year, the Royal Society for the Protection of Birds (RSPB) asks people to do a survey of the birds seen in their gardens. In 2011, over half a million people took part and you see some of the results the RSPB received in the two tables below:

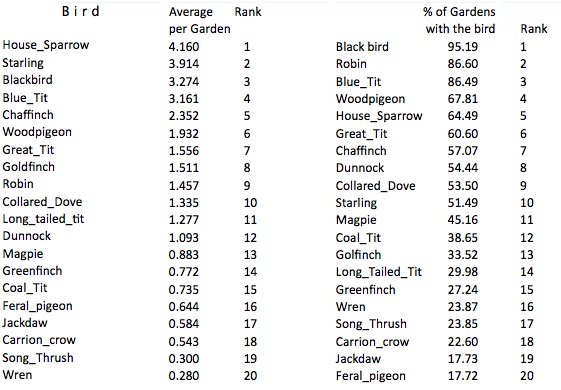
The first column of both tables shows the names of the birds.  The second column of the left-hand table shows the average numbers of those birds across all the gardens. The second column of the right-hand table shows the percentage of all the gardens in which those birds were identified. 

You may need to have a chat with others to get a clear picture of the meanings of "average per garden' and "percentage of gardens with the bird".

Have a general look at both tables. What can you say about them?

What can you can about the ranking of the starling?

What can you say about the ranking of the robin?

Why do this problem?

This activity gives pupils an opportunity to engage in fruitful discussion about data presented to them. It gives a forum for a whole group or class discussion, and provides a situation where pupils need to listen carefully to what others are saying, and follow the thinking behind what has been said. 

Possible approach

The activity is one which probably works best as a dicussion among a group or class. There will be a need to refer to the data throughout so some form of display could be necessary and it might be helpful to print off copies of the data on this sheet.
 
It may be that through the discussion, some questions arise, perhaps about the data itself or about the reasons behind the results presented in the data.  These questions may lead to groups of children collecting further data or conducting research in an attempt to obtain answers.
 
This activity is also useful to help pupils learn about what is important when having a discussion where others have ideas that may then be validated and accepted or rejected. This, of course requires the development of good listening skills.


Key questions

Why do you say that?
What do others think about that?
 

Possible extension

Explore other websites that produce child-friendly data and encourage learners to decide what to interrogate and what data collection to pursue.
 

Possible support

Try to step back as the children discuss the data.  Depending on their experience, you may need to act as a 'chairperson' and encourage all to contribute.

You may also like

Class 5's Names

Class 5 were looking at the first letter of each of their names. They created different charts to show this information. Can you work out which member of the class was away on that day?

  • Tech help
  • Accessibility Statement
  • Sign up to our newsletter
  • Twitter X logo

The NRICH Project aims to enrich the mathematical experiences of all learners. To support this aim, members of the NRICH team work in a wide range of capacities, including providing professional development for teachers wishing to embed rich mathematical tasks into everyday classroom practice.

NRICH is part of the family of activities in the Millennium Mathematics Project.

University of Cambridge logo NRICH logo