Skip over navigation
Cambridge University Faculty of Mathematics NRich logo
menu search
  • Teachers expand_more
    • Early years
    • Primary
    • Secondary
    • Post-16
    • Events
    • Professional development
  • Students expand_more
    • Primary
    • Secondary
    • Post-16
  • Parents expand_more
    • Early Years
    • Primary
    • Secondary
    • Post-16
  • Problem-Solving Schools
  • About NRICH expand_more
    • About us
    • Impact stories
    • Support us
    • Our funders
    • Contact us
  • search

Or search by topic

Number and algebra

  • The Number System and Place Value
  • Calculations and Numerical Methods
  • Fractions, Decimals, Percentages, Ratio and Proportion
  • Properties of Numbers
  • Patterns, Sequences and Structure
  • Algebraic expressions, equations and formulae
  • Coordinates, Functions and Graphs

Geometry and measure

  • Angles, Polygons, and Geometrical Proof
  • 3D Geometry, Shape and Space
  • Measuring and calculating with units
  • Transformations and constructions
  • Pythagoras and Trigonometry
  • Vectors and Matrices

Probability and statistics

  • Handling, Processing and Representing Data
  • Probability

Working mathematically

  • Thinking mathematically
  • Developing positive attitudes
  • Cross-curricular contexts

Advanced mathematics

  • Decision Mathematics and Combinatorics
  • Advanced Probability and Statistics
  • Mechanics
  • Calculus

For younger learners

  • Early Years Foundation Stage

Charting More Success

Age 11 to 16
Challenge Level Yellow star
  • Problem
  • Getting Started
  • Student Solutions
  • Teachers' Resources


If you are a teacher, click here for a version of the problem suitable for classroom use, together with supporting materials. Otherwise, read on...

This problem explores the same ideas as Charting Success.

Below are some graphs, charts and diagrams created by sports statisticians, trainers or competitors to help them to analyse performance, inform training programmes or improve motivation.

For each diagram, consider the following questions:

  • What information can you deduce from each diagram?
  • Are the diagrams effective in communicating the information?
  • If you were a sports coach (for the team in question, or perhaps their future opponents), how might you use the information in each diagram?
  • Do the diagrams raise any interesting questions for you? Is there a story to be told?

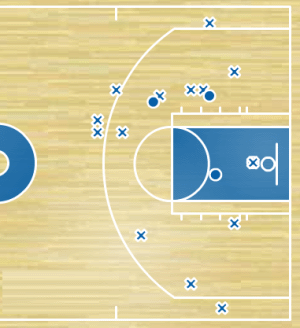
Baskets made (o) and missed (x) in the fourth quarter of a basketball match

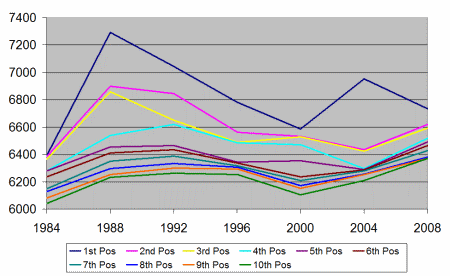
Finishing Scores of top ten athletes in Olympic heptathlon

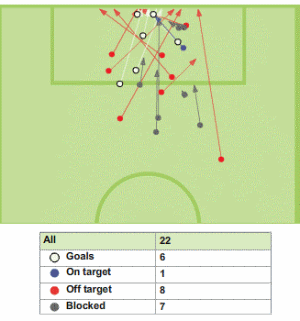
Shots on and off target for one team in a football match


You may also like

Football Crazy Hockey Mad

In a league of 5 football teams which play in a round robin tournament show that it is possible for all five teams to be league leaders.

Coordinates and Descartes

Have you ever wondered how maps are made? Or perhaps who first thought of the idea of designing maps? We're here to answer these questions for you.

Florence Nightingale - the Compassionate Mathematician

Florence Nightingale may be well known for her role as a nurse, but she was also an excellent mathematician, collecting and analysing data to help improve hospital conditions.

  • Tech help
  • Accessibility Statement
  • Sign up to our newsletter
  • Twitter X logo

The NRICH Project aims to enrich the mathematical experiences of all learners. To support this aim, members of the NRICH team work in a wide range of capacities, including providing professional development for teachers wishing to embed rich mathematical tasks into everyday classroom practice.

NRICH is part of the family of activities in the Millennium Mathematics Project.

University of Cambridge logo NRICH logo