Or search by topic
Number and algebra
Geometry and measure
Probability and statistics
Working mathematically
Advanced mathematics
For younger learners
Polar Bearings


Often when we want to indicate the position of an object, we refer to its distance and direction. We can use a coordinate system based on this, giving the distance from an origin and a direction as an angle measured anticlockwise from the horizontal.
Here is a map of Scotland.
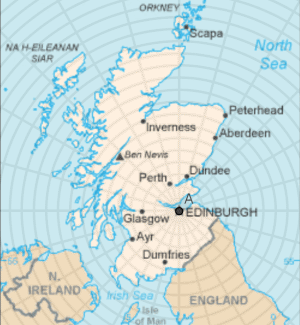
The grid on this map measures from an origin at Edinburgh, and the lines indicate distances from Edinburgh at 20km intervals.
Lines are marked radiating from Edinburgh at $15^\circ$ or $\frac{\pi}{12}$ radian intervals.
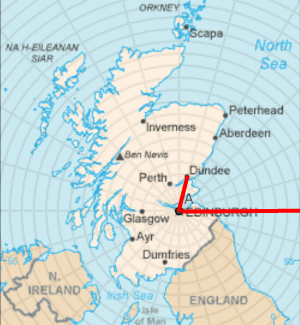
Dundee is to the north and slightly to the east of Edinburgh. I need to travel a distance of approximately 60km in a direction $\frac{5\pi}{12}$ anticlockwise from the horizontal.
I can express the position of Dundee in polar coordinates as $(60, \frac{5\pi}{12})$.
The distance coordinate is usually called $r$, and the direction is $\theta$, so a polar coordinate pair is $(r, \theta)$.
Can you express the position of some other places on the map using polar coordinates?
By giving a functional relationship between $r$ and $\theta$, we can represent curves on the polar coordinate plane. Can you sketch the following functions?
a) $r=2$
b) $\theta = \frac{\pi}{4}$
c) $r=\theta$
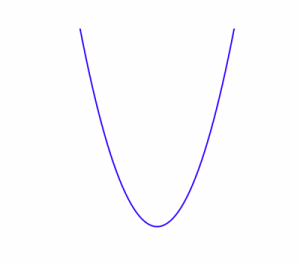
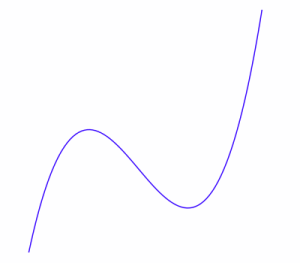
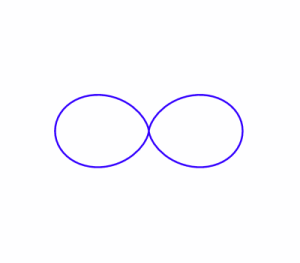
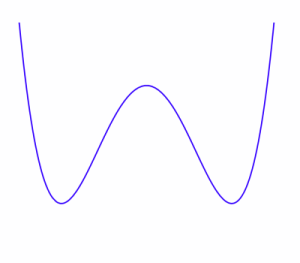
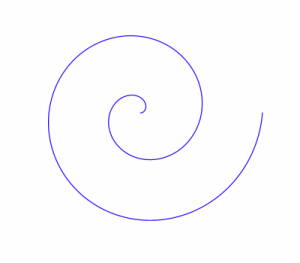
Here are some sketches of curves. You can choose where to put the origin.
Which ones do you think it would be easier to express in Cartesian $(x,y)$ coordinates?
Which ones do you think would be easier to express in Polar $(r, \theta)$ coordinates?
|
A |
B |
|
C |
D |
|
E |
F |
|
G |
H |
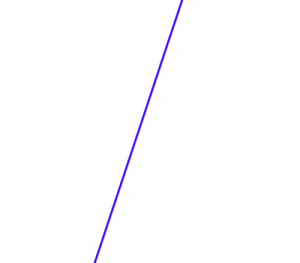
I |
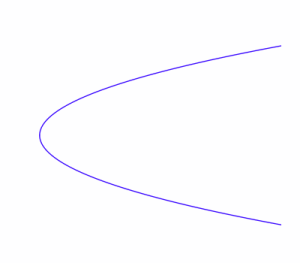
J |
Are there any graphs where you could easily use either coordinate system?
If the origin had been specified, how might it have affected your decision?
Try to find functional forms, in either cartesian or polar coordinates, to create graphs that closely resemble those above.
You may wish to use graph plotting software to help you; some useful graphing tools can be found here.
You can read more about Polar Coordinates in this article.
Earth Orbit is a challenging problem about orbits that shows the real-life applications of polar coordinates.
You may also like
Maltese Cross
Sketch the graph of $xy(x^2 - y^2) = x^2 + y^2$ consisting of four curves and a single point at the origin. Convert to polar form. Describe the symmetries of the graph.
Polar Flower
This polar equation is a quadratic. Plot the graph given by each factor to draw the flower.


