Investigating Epidemics


Why do epidemics take off? Why don't they just carry on for ever once they've started? These simple models will help us to understand what's going on, and how science can help us to prevent epidemics happening in the first place.
Standing Disease
Equipment required: people - lots of them!
- Start with everyone sitting down.
- The first person to be infected with Standing Disease stands up - choose someone. This is step 0.
- They infect two more people - choose them. They also stand up. This is step 1.
- They each infect two more people - choose them from amongst those still sitting. This is step 2.
- Continue until everyone is infected, keeping count of how many steps there are in the epidemic.
Questions to consider:
- How many people in the room? How many steps to infect them all?
- If you repeat the epidemic, will you get the same result?
- What difference would it make if 3 people were infected at each stage? Or more?
- Can you suggest a rule?
- What would happen if the class were bigger, if the whole school took part, for instance? How many steps would it take?
- What about everyone in your town/village?
- What about everyone in the country? Or the world?
- What useful things does this model tell you about how epidemics spread?
- What are its limitations?
Network Disease
Equipment required: people, each with a slip of paper and a pen/pencil, plus optional counters and string
- Before the epidemic starts, everyone should write the names of two people on their piece of paper without discussing their choices.
- Everyone stands up.
- Choose one person to start. This is step 0.
- They choose the two people whose names they have written. They stand up. This is step 1.
- Continue as for Standing Disease, but choosing each time the people written on the piece of paper. If they are already standing, they just remain standing - their names are not substituted for someone not yet standing.
Questions to consider:
 How many steps did the epidemic run for this time?
- Were there any people who were never infected?
- If you repeat the epidemic, will you get the same result? Try it.
- Record the number of steps and the number of people not infected for several runs of the epidemic. What is the average number of steps, and the average number of people infected?
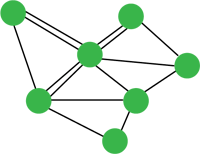
- For one run of the epidemic, draw a network diagram of the connections in the class like the one on the right. Each person is represented with a dot, and a line is drawn between two dots if one person chose the other. You could use counters and string to help you.
- If you were going to vaccinate a small number of people, who would you choose to vaccinate? Why?
- What useful things does this model tell you about how epidemics spread?
- What are its limitations?
Counter Plague
Equipment required: one die and about 20-30 counters per small group (any colour)
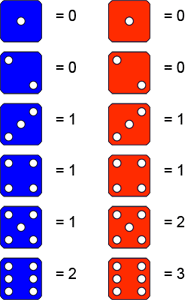
- Choose either the blue or red die on the right. The diagrams give you the number of new cases each time you throw your die.
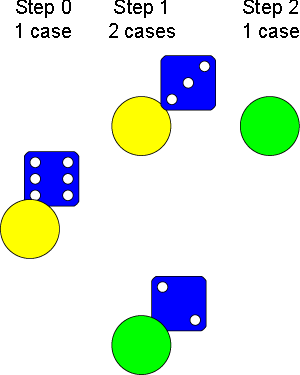
- Place one counter on the table top. This is the first case, and represents step 0.
- Throw the die, and put the appropriate number of counters to the right of the first case. This is step 1.
- Repeat for each infected person at step 1 to see how many new infections there are at step 2, placing the appropriate number of counter to the right of the infecting person (as in the diagram below).
- Repeat until either the epidemic dies out or you run out of counters.
- Record the number of infections at each step on a simple diagram or graph.
 Repeat the epidemic with the same colour die and then see what happens if you use the other die.
- What useful things does this model tell you about how epidemics spread?
What are its limitations?
Questions to consider:
- Does the epidemic take off or die out? Are the results different for the blue die and for the red, or pretty much the same?
- On average, how many steps does the epidemic run for in each case?
- How do you explain your observations?
- Try testing out any theories you have, using your own values for the number of infections corresponding to each result of throwing the die.
- Looking at the number of infections for each outcome on the blue and red dice, do you think that in general an epidemic should be established or die out? Why?
Create your own epidemic model
There are other simple models which help us to explain features of epidemics, and you can find some on our sister website, Motivate.
You may also like to try creating your own model. What features would you like your model to have? Have could you incorporate them in a simple model?
Related Collections
You may also like
Rule of Three
If it takes four men one day to build a wall, how long does it take 60,000 men to build a similar wall?
Crossing the Atlantic
Every day at noon a boat leaves Le Havre for New York while another boat leaves New York for Le Havre. The ocean crossing takes seven days. How many boats will each boat cross during their journey?
Fixing the Odds
You have two bags, four red balls and four white balls. You must put all the balls in the bags although you are allowed to have one bag empty. How should you distribute the balls between the two bags so as to make the probability of choosing a red ball as small as possible and what will the probability be in that case?