Skip over navigation


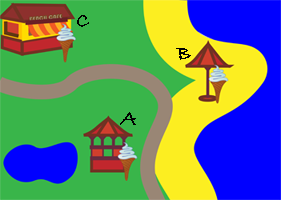
Louis plans to set up a new icecream business by the seaside. But where should he set up his first stall?
If he sets up shop at the Beach Cafe (C), the weather won't matter. On the other hand, if he puts his stall on the beach (B), he'll do much better if it's sunny, but much worse if it rains.
He could go for the bandstand (A) instead ...
What should he do?
Now decide where Louis should put his first icecream stall. The table tells you how many dollars he can expect to make per day in each location:
Now pick a cube How much did Louis make?
See if experiment confirms your choice.
If you work in a group of three, each of you could choose one location and see whose location does best.
You could record the weather each day, then compare the financial outcome for each location day by day, and see which did best over the month.
Which location did best? Does this surprise you?
Since rainy and sunny days are equally likely in this model, which location would be Louis' best option over a 6 month season?
Now think about the model we have set up: what assumptions have we made?
Business is doing quite well, so Louis decides to invest in another icecream stall further round the beach, where it won't compete with his first stall, and where there are likely to be more people.
There are three locations he thinks might do: on the beach (J), under an umbrella in front of the pier (K), or in a cafe at the end of the pier (L). He will have to be careful which location he chooses, because some of them will mean he loses money if it rains - although they will also be good earners if the sun shines. Also, Big Frankie is in charge here, and he has to be paid for letting Louis open a business on his patch - and Big Frankie will expect to be paid whatever the weather.
The table gives Louis' expected income and outgoings per day:
Which location do you think Louis should go for?
What is his expected income in each location over a period of a month (30 days) if he considers just the income on the icecreams?
What is his expected income in each location of a period of a month when he takes Big Frankie's payment into account?
So which location would be best for him?
Is it worth his while opening this second stall?
Would your decision be different if Louis' business will fold if his total income drops below zero?
Do a running total for a 30 day experiment and see if any of the possible locations mean Louis goes out of business.
You may find this spreadsheet helps with this.
You will need to decide what you're going to do if the first day or two are rainy - does Louis go bust immediately, or do you think he has a cushion from his first stall?
This isn't very realistic, however, so now we are going to make the model a little more sophisticated.
Louis lives in an area where rainy and sunny days are both as likely as each other. But he notices that if it is sunny one day, it is more often sunny the following day, and if it is rainy one day, the next day is more likely to be wet.
For the first day, put two yellow and two blue cubes in the bag. Take one out and note what colour it is, then replace it in the bag.
For day 3 and successive days, replace the cube for day 2, and make sure that there are the appropriate cubes in the bag given the weather on the previous day.
Use the cubes to give a weather pattern over 30 days. How many sunny/rainy days were there?
Compare your results with other groups? If you average the data across the class, what do you get?
Can you predict what the expected number of sunny days might be over 30 days?
To check what we would expect, draw a tree diagram for days 1 and 2, using the probability of a sunny or rainy day as given by the cubes.
What is the probability of a sunny day on day 2? Does the answer surprise you?
Now extend your tree diagram to a third day.
What is the probability of a sunny day on day 3? Again, are you surprised?
What does this suggest for the probability of a sunny day on day n? Can you justify your answer?
Can you think of ways you could improve this model further?

Louis' Ice Cream Business
Age 14 to 16
Challenge Level 

Louis plans to set up a new icecream business by the seaside. But where should he set up his first stall?
If he sets up shop at the Beach Cafe (C), the weather won't matter. On the other hand, if he puts his stall on the beach (B), he'll do much better if it's sunny, but much worse if it rains.
He could go for the bandstand (A) instead ...
What should he do?
You can model Louis' options using yellow cubes for sunny days and blue cubes for rainy days.
Put two blue and two yellow cubes in a bag so that the colour of the cubes cannot be seen.
Now decide where Louis should put his first icecream stall. The table tells you how many dollars he can expect to make per day in each location:
| Rain (blue) | Sunny (yellow) | |
|---|---|---|
| Bandstand, A | 88 | 168 |
| Beach, B | 50 | 256 |
| Beach cafe, C | 100 | 100 |
Now pick a cube How much did Louis make?
- Was this a wise choice?
- If you were to choose again, would you stick with the same option or change to another?
- If you would not change, why not? If you would change, which would you choose and why?
- Which do you think would be Louis' best option over a month (30 days)?
See if experiment confirms your choice.
If you work in a group of three, each of you could choose one location and see whose location does best.
You could record the weather each day, then compare the financial outcome for each location day by day, and see which did best over the month.
Which location did best? Does this surprise you?
Since rainy and sunny days are equally likely in this model, which location would be Louis' best option over a 6 month season?
Now think about the model we have set up: what assumptions have we made?
Louis opens a second icecream stall!
Business is doing quite well, so Louis decides to invest in another icecream stall further round the beach, where it won't compete with his first stall, and where there are likely to be more people.
There are three locations he thinks might do: on the beach (J), under an umbrella in front of the pier (K), or in a cafe at the end of the pier (L). He will have to be careful which location he chooses, because some of them will mean he loses money if it rains - although they will also be good earners if the sun shines. Also, Big Frankie is in charge here, and he has to be paid for letting Louis open a business on his patch - and Big Frankie will expect to be paid whatever the weather.
The table gives Louis' expected income and outgoings per day:
| Payment to Big Frankie |
Rain (blue) |
Sunny (yellow) |
|
|---|---|---|---|
| Beach (J) | -30 | -300 | 700 |
| Umbrella in front of the pier (K) | -50 | -100 | 300 |
| Cafe at the end of the pier (L) | -200 | 50 | 500 |
Which location do you think Louis should go for?
What is his expected income in each location over a period of a month (30 days) if he considers just the income on the icecreams?
What is his expected income in each location of a period of a month when he takes Big Frankie's payment into account?
So which location would be best for him?
Is it worth his while opening this second stall?
Would your decision be different if Louis' business will fold if his total income drops below zero?
Do a running total for a 30 day experiment and see if any of the possible locations mean Louis goes out of business.
You may find this spreadsheet helps with this.
You will need to decide what you're going to do if the first day or two are rainy - does Louis go bust immediately, or do you think he has a cushion from his first stall?
Developing the model
This isn't very realistic, however, so now we are going to make the model a little more sophisticated.
Louis lives in an area where rainy and sunny days are both as likely as each other. But he notices that if it is sunny one day, it is more often sunny the following day, and if it is rainy one day, the next day is more likely to be wet.
For the first day, put two yellow and two blue cubes in the bag. Take one out and note what colour it is, then replace it in the bag.
- If it is yellow (so the first day was a sunny day), add another four yellow cubes to your bag.
- If the first cube is blue (so the first day was a rainy day), add another four blue cubes to your bag.
For day 3 and successive days, replace the cube for day 2, and make sure that there are the appropriate cubes in the bag given the weather on the previous day.
Use the cubes to give a weather pattern over 30 days. How many sunny/rainy days were there?
Compare your results with other groups? If you average the data across the class, what do you get?
Can you predict what the expected number of sunny days might be over 30 days?
To check what we would expect, draw a tree diagram for days 1 and 2, using the probability of a sunny or rainy day as given by the cubes.
What is the probability of a sunny day on day 2? Does the answer surprise you?
Now extend your tree diagram to a third day.
What is the probability of a sunny day on day 3? Again, are you surprised?
What does this suggest for the probability of a sunny day on day n? Can you justify your answer?
Can you think of ways you could improve this model further?
You may also like
Prize Giving
What's the fairest way to choose 2 from 8 potential prize winners? How likely are you to be chosen?