Skip over navigation

Do you believe that a crowd can be more intelligent than any individual in the crowd?
Find out with an easy experiment!
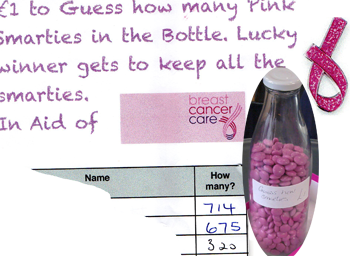
Fill a jar with jelly beans (or similar small items) and ask as many people as possible to guess how many there are.
Count the jelly beans, and give them to the person whose guess is closest, but keep the record of all the guesses made.
It's often the case that the crowd is better at guessing than the individuals in it! Don't believe it?
Calculate the average number of guesses - you could calculate both the median and the mean.
So who was wiser here - the crowd (as represented by the averages) or individuals?

Now display the guesses in a graph. It's easy to build up a histogram, using squared paper:
Or is it skewed to the left or the right?
The graph shown here is skewed to the right (by one particularly large guess).
Or search by topic
Number and algebra
Geometry and measure
Probability and statistics
Working mathematically
Advanced mathematics
For younger learners
The Wisdom of the Crowd
Age 11 to 16
Challenge Level 


- Problem
- Teachers' Resources

Do you believe that a crowd can be more intelligent than any individual in the crowd?
Find out with an easy experiment!
Fill a jar with jelly beans (or similar small items) and ask as many people as possible to guess how many there are.
Count the jelly beans, and give them to the person whose guess is closest, but keep the record of all the guesses made.
How close was the best guess?
How far off were the worst guesses?
Were there more guesses below the actual number or above it?
How far off were the worst guesses?
Were there more guesses below the actual number or above it?
It's often the case that the crowd is better at guessing than the individuals in it! Don't believe it?
Calculate the average number of guesses - you could calculate both the median and the mean.
How close are they to the actual number?
How many people did better than the median?
How many people did better than the mean?
How many people did better than the median?
How many people did better than the mean?
So who was wiser here - the crowd (as represented by the averages) or individuals?

Now display the guesses in a graph. It's easy to build up a histogram, using squared paper:
- put sensible intervals along the horizontal axis
- for each guess, put a small cross in squares in the centre of each interval, so that you build up a column for each interval (as on the right)
Or is it skewed to the left or the right?
The graph shown here is skewed to the right (by one particularly large guess).

