Skip over navigation


Why Start with Tree Diagrams?
This article is part of our collection Great Expectations: Probability through Problems.
The tree diagram is fundamental to our approach to learning probability. Right from the start, we expect students to:
In Which Team Will Win? students are asked to record their results in a table, then tally, and then transfer them as whole numbers to a tree diagram, a process which 10 and 11 year-old students were able to do quite easily in the lessons I observed.
In one lesson, the teacher then put the aggregated results from the whole class on a tree diagram on the board, which he then used for a football-style commentary in a dialogue between him and the class:
Using the tree diagram to motivate a dialogue likes this helps students to realise that the outcome YB is different from the outcome BY quite naturally, because the story of the match is different in the two cases.
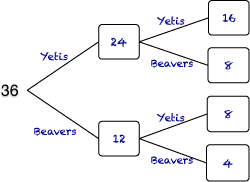 Using tree diagrams as a means to represent data using whole numbers also helps students to become very familiar with them, and comfortable using them, long before they need to use them to calculate probabilities. The diagram on the
right shows the tree diagram for the expected results over 36 matches for Which Team Will Win? Like putting their own results onto a tree diagram, 10 and 11 year-old students were quite comfortable with working out together the numbers to put in the boxes, using the fact that the Yetis had four chances to score compared to the Beavers two
chances.
Using tree diagrams as a means to represent data using whole numbers also helps students to become very familiar with them, and comfortable using them, long before they need to use them to calculate probabilities. The diagram on the
right shows the tree diagram for the expected results over 36 matches for Which Team Will Win? Like putting their own results onto a tree diagram, 10 and 11 year-old students were quite comfortable with working out together the numbers to put in the boxes, using the fact that the Yetis had four chances to score compared to the Beavers two
chances.
It is crucial not to rush into fractions too soon.
Staying with whole numbers on tree diagrams and on 2-way tables helps students to become aware of the importance of identifying correctly the appropriate values for the numerator and denominator, when expressing an answer as a proportion and then expressing this verbally as a probability. This can be explored through The Dog Ate My Homework!
The tree diagram is fundamental to our approach to learning probability. Right from the start, we expect students to:
- Collect data, which is then represented on a tree diagram and a 2-way table.
- Ask questions about what the data is saying.
- Test their impressions about what the data is saying against results aggregated across the whole class.
- Move from counts to proportions.
- Consider what the proportions will settle down to as we do more experiments.
- Compare their experimental results with what we would expect to happen - working from a tree diagram and 2-way table completed with the expected number of each outcome at each stage, using simple probabilities (eg. chance of getting a blue face on a die with four yellow and two blue faces) to find expected results in whole numbers (natural frequencies).
In Which Team Will Win? students are asked to record their results in a table, then tally, and then transfer them as whole numbers to a tree diagram, a process which 10 and 11 year-old students were able to do quite easily in the lessons I observed.
In one lesson, the teacher then put the aggregated results from the whole class on a tree diagram on the board, which he then used for a football-style commentary in a dialogue between him and the class:
What's the story for these branches?
The Yetis scored, then scored again! A win to the Yetis!
And how about these branches? What's the story here?
The Yetis scored, but then the Beavers fought back. It's a draw!
What about these branches?
The Beavers got off to a great start, but they couldn't keep it up. The Yetis came back to equalise.
And these branches?
The Beavers got off to a great start. They were so motivated by scoring early on that they kept up the pressure on the Yetis, scoring again in the second half. It's a win for the Beavers!
Using the tree diagram to motivate a dialogue likes this helps students to realise that the outcome YB is different from the outcome BY quite naturally, because the story of the match is different in the two cases.
Using tree diagrams as a means to represent data using whole numbers also helps students to become very familiar with them, and comfortable using them, long before they need to use them to calculate probabilities. The diagram on the
right shows the tree diagram for the expected results over 36 matches for Which Team Will Win? Like putting their own results onto a tree diagram, 10 and 11 year-old students were quite comfortable with working out together the numbers to put in the boxes, using the fact that the Yetis had four chances to score compared to the Beavers two
chances.It is crucial not to rush into fractions too soon.
Staying with whole numbers on tree diagrams and on 2-way tables helps students to become aware of the importance of identifying correctly the appropriate values for the numerator and denominator, when expressing an answer as a proportion and then expressing this verbally as a probability. This can be explored through The Dog Ate My Homework!