Skip over navigation


Secondary data is data that has already been collected so you do not have to collect it for yourself. Weather data is easily available and there are lots of interesting questions to explore, making comparisons over time and space.
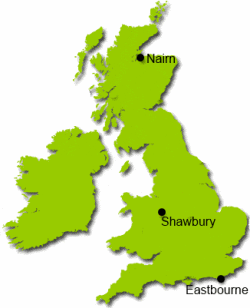 Here is a spreadsheet containing weather data for Shawbury, Eastbourne and Nairn.
What questions or hypothesis can you come up with, that this data could help you to answer?
What analysis will you need to do to test your hypotheses?
Here are some aspects to consider:
You could compare data from the three different weather stations.
You could compare different months of the year, or different seasons.
You could look for trends over time - how has temperature or rainfall changed over the years?
Send us your reports with your hypothesis, data analysis and conclusions using the Submit a Solution link.


What's the Weather Like?
Age 11 to 14
Challenge Level 

Secondary data is data that has already been collected so you do not have to collect it for yourself. Weather data is easily available and there are lots of interesting questions to explore, making comparisons over time and space.
Here is a spreadsheet containing weather data for Shawbury, Eastbourne and Nairn.
What questions or hypothesis can you come up with, that this data could help you to answer?
What analysis will you need to do to test your hypotheses?
Here are some aspects to consider:
You could compare data from the three different weather stations.
You could compare different months of the year, or different seasons.
You could look for trends over time - how has temperature or rainfall changed over the years?
Send us your reports with your hypothesis, data analysis and conclusions using the Submit a Solution link.
The spreadsheet contains public sector information licensed under the Open Government Licence v1.0, taken from the Met Office website.
You may also like
Football Crazy Hockey Mad
In a league of 5 football teams which play in a round robin tournament show that it is possible for all five teams to be league leaders.
Coordinates and Descartes
Have you ever wondered how maps are made? Or perhaps who first thought of the idea of designing maps? We're here to answer these questions for you.
Florence Nightingale - the Compassionate Mathematician
Florence Nightingale may be well known for her role as a nurse, but she was also an excellent mathematician, collecting and analysing data to help improve hospital conditions.