Skip over navigation


Statistics in Exams: Hypothesis Testing
If you have worked through the other article in this module, you will have covered all of the crucial ideas behind continuous and discrete random variables. However, being able to perform tests on hypotheses for the particular parameters of a distribution is also extremely important. Thus, it is this we now turn our attention to.
Conducting a Hypothesis Test
So what is a hypothesis test? Well it is a means of making inference about the parameters of a distribution using data gathered from a study. We specify null and alternative hypotheses, which characterise two possibilities for our parameter. Mathematically, we want to determine if there is enough evidence to reject this null hypothesis. To do this we need a test statistic, and a critical region for this test statistic such that if it lies in this region we reject the null hypothesis.
Finally, we must concern ourselves with the chance of making a mistake whilst conducting this hypothesis test, and how to control the chance of making such mistakes. We say we've made a type-I error when we reject a null hypothesis that's true, and a type-II error when we accept a null hypothesis that's false. We want both of these things to happen with a small probability. Thus we usually determine our critical region according to controlling the type-I error. Type-II error can then be controlled relative to this by determining a sample size large enough or by setting an appropriate alternative hypothesis. If any of this is seeming unfamiliar, hopefully the example below should illuminate things far better.
Example: Hypothesis Testing and the Normal Distribution
Now, let's test our skills with hypothesis tests. Below is Question 14 from 2004 Paper III. This question should help you appreciate all of the basics behind hypothesis testing.
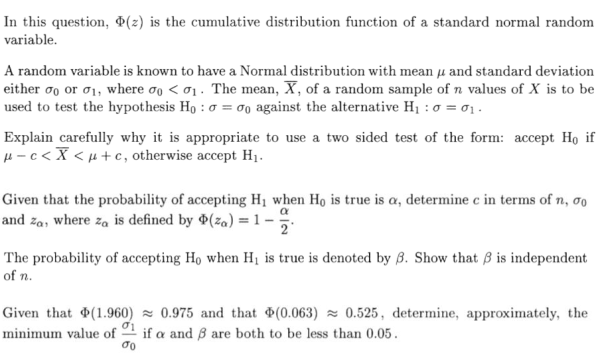
So, it begins by asking us why a test that accepts \( H_0 \) when \( \bar{X} \in (\mu - c, \mu + c) \) is appropriate. Well, this is simple: as we noted before we want to set up a critical region such that when our test statistic (here \( \bar{X} \)) lies in that critical region it implies deviation from \( H_0 \). This is clearly true here; for if \( H_0 \) were true, \( \bar{X} \) would have a higher probability of being in the region stated than if \( H_1 \) were true.
The next part simply wants us to established a test with a probability of committing a type-I error of \( \alpha \). To do this, we need to know that under \( H_0 \), \( \bar{X} \) has a Normal distribution with mean \( \mu \) and standard deviation \( \sigma_0/\sqrt{n} \), i.e. \( \bar{X} \sim (\mu,\sigma_0/\sqrt{n}) \). If you've not seen this before, it's a very important thing to remember. From this then, we can go ahead and examine the probability of lying in our critical region under \( H_0 \):
\( \hspace{2.3 in} \mathbb{P}(\left | \bar{X} - \mu \right | > c) = 2\left [ 1 - \Phi\left( \frac{c}{(\frac{\sigma_0}{\sqrt{n}})} \right ) \right ]. \)
But we want this to be \( \alpha \), i.e. we want:
\( \hspace{1.8 in} \Phi\left( \frac{c}{(\frac{\sigma_0}{\sqrt{n}})} \right ) = 1-\frac{\alpha}{2} \Rightarrow \frac{c}{(\frac{\sigma_0}{\sqrt{n}})} = z_\alpha \Rightarrow c=\frac{\sigma_0 z_\alpha}{\sqrt{n}}. \)
Now, to find \( \beta \) and show it is independent of \(n\), we use that under \(H_1\), \( \bar{X} \) instead has a Normal distribution with mean \( \mu \) and standard deviation \( \sigma_1/\sqrt{n} \). Then:
\( \hspace{0.6 in} \mathbb{P}(\left | \bar{X} - \mu \right | > c) = 1 - 2\left [ 1 - \Phi\left( \frac{c}{(\frac{\sigma_1}{\sqrt{n}})} \right ) \right ] = 2\Phi\left( \frac{c}{(\frac{\sigma_1}{\sqrt{n}})} \right ) - 1=2\Phi\left( \frac{\sigma_0 z_\alpha}{\sigma_1} \right ) - 1, \)
so \( \beta \) is indeed independent of \( n \).
To complete the final part, we can first note that for \( \alpha \) to be less than \( 0.05 \), we immediately have \( z_\alpha > 1.96 \). And the last step is to employ what we've learnt about \( \beta \):
\( \hspace{1.5 in} \beta<0.05 \Rightarrow \Phi\left( \frac{\sigma_0 z_\alpha}{\sigma_1} \right)<\frac{1+0.05}{2} = 0.525 \Rightarrow \frac{\sigma_0 z_\alpha}{\sigma_1} <0.063. \)
Thus, for both of these conditions to hold, we must have:
\( \hspace{1.7 in} 0.063>\frac{\sigma_0 z_\alpha}{\sigma_1} > \frac{1.96\sigma_0}{\sigma_1} \Rightarrow \frac{\sigma_1}{\sigma_0} >\frac{1.96}{0.063}=\frac{280}{9} \approx 30. \)
And that's the question done. This wasn't an easy one, but it covers all of the key elements of hypothesis testing: get to grips with it and you will definitely be ready to attempt some questions yourself.
Summary
So what have we learnt above? Well, as with any area of mathematics, in order to have the best chance of completing a STEP question you should make sure you can complete the relevant questions you've covered in A-Level without difficulty. Make sure you know the properties of the key random variables, and are comfortable working with them. Then, go ahead and get practising!
Conducting a Hypothesis Test
So what is a hypothesis test? Well it is a means of making inference about the parameters of a distribution using data gathered from a study. We specify null and alternative hypotheses, which characterise two possibilities for our parameter. Mathematically, we want to determine if there is enough evidence to reject this null hypothesis. To do this we need a test statistic, and a critical region for this test statistic such that if it lies in this region we reject the null hypothesis.
Finally, we must concern ourselves with the chance of making a mistake whilst conducting this hypothesis test, and how to control the chance of making such mistakes. We say we've made a type-I error when we reject a null hypothesis that's true, and a type-II error when we accept a null hypothesis that's false. We want both of these things to happen with a small probability. Thus we usually determine our critical region according to controlling the type-I error. Type-II error can then be controlled relative to this by determining a sample size large enough or by setting an appropriate alternative hypothesis. If any of this is seeming unfamiliar, hopefully the example below should illuminate things far better.
Example: Hypothesis Testing and the Normal Distribution
Now, let's test our skills with hypothesis tests. Below is Question 14 from 2004 Paper III. This question should help you appreciate all of the basics behind hypothesis testing.
So, it begins by asking us why a test that accepts \( H_0 \) when \( \bar{X} \in (\mu - c, \mu + c) \) is appropriate. Well, this is simple: as we noted before we want to set up a critical region such that when our test statistic (here \( \bar{X} \)) lies in that critical region it implies deviation from \( H_0 \). This is clearly true here; for if \( H_0 \) were true, \( \bar{X} \) would have a higher probability of being in the region stated than if \( H_1 \) were true.
The next part simply wants us to established a test with a probability of committing a type-I error of \( \alpha \). To do this, we need to know that under \( H_0 \), \( \bar{X} \) has a Normal distribution with mean \( \mu \) and standard deviation \( \sigma_0/\sqrt{n} \), i.e. \( \bar{X} \sim (\mu,\sigma_0/\sqrt{n}) \). If you've not seen this before, it's a very important thing to remember. From this then, we can go ahead and examine the probability of lying in our critical region under \( H_0 \):
\( \hspace{2.3 in} \mathbb{P}(\left | \bar{X} - \mu \right | > c) = 2\left [ 1 - \Phi\left( \frac{c}{(\frac{\sigma_0}{\sqrt{n}})} \right ) \right ]. \)
But we want this to be \( \alpha \), i.e. we want:
\( \hspace{1.8 in} \Phi\left( \frac{c}{(\frac{\sigma_0}{\sqrt{n}})} \right ) = 1-\frac{\alpha}{2} \Rightarrow \frac{c}{(\frac{\sigma_0}{\sqrt{n}})} = z_\alpha \Rightarrow c=\frac{\sigma_0 z_\alpha}{\sqrt{n}}. \)
Now, to find \( \beta \) and show it is independent of \(n\), we use that under \(H_1\), \( \bar{X} \) instead has a Normal distribution with mean \( \mu \) and standard deviation \( \sigma_1/\sqrt{n} \). Then:
\( \hspace{0.6 in} \mathbb{P}(\left | \bar{X} - \mu \right | > c) = 1 - 2\left [ 1 - \Phi\left( \frac{c}{(\frac{\sigma_1}{\sqrt{n}})} \right ) \right ] = 2\Phi\left( \frac{c}{(\frac{\sigma_1}{\sqrt{n}})} \right ) - 1=2\Phi\left( \frac{\sigma_0 z_\alpha}{\sigma_1} \right ) - 1, \)
so \( \beta \) is indeed independent of \( n \).
To complete the final part, we can first note that for \( \alpha \) to be less than \( 0.05 \), we immediately have \( z_\alpha > 1.96 \). And the last step is to employ what we've learnt about \( \beta \):
\( \hspace{1.5 in} \beta<0.05 \Rightarrow \Phi\left( \frac{\sigma_0 z_\alpha}{\sigma_1} \right)<\frac{1+0.05}{2} = 0.525 \Rightarrow \frac{\sigma_0 z_\alpha}{\sigma_1} <0.063. \)
Thus, for both of these conditions to hold, we must have:
\( \hspace{1.7 in} 0.063>\frac{\sigma_0 z_\alpha}{\sigma_1} > \frac{1.96\sigma_0}{\sigma_1} \Rightarrow \frac{\sigma_1}{\sigma_0} >\frac{1.96}{0.063}=\frac{280}{9} \approx 30. \)
And that's the question done. This wasn't an easy one, but it covers all of the key elements of hypothesis testing: get to grips with it and you will definitely be ready to attempt some questions yourself.
Summary
So what have we learnt above? Well, as with any area of mathematics, in order to have the best chance of completing a STEP question you should make sure you can complete the relevant questions you've covered in A-Level without difficulty. Make sure you know the properties of the key random variables, and are comfortable working with them. Then, go ahead and get practising!