Quadratic Matching


Kaartigan form Wilson's School in the UK, Deeya from St Mary's Catholic High School Astley the UK and Mahdi from Mahatma Gandhi International School in India went through the statements, and Sammy from Lancing College in the UK went through the graphs, matching them to statements. The images shown are from Sammy's work.
Mahdi described the strategy:
I saw that there were a few statements that applied to more than one graph. So I picked statements that seemed very specific that specified only one graph. Progressively, a lot of the graphs would get ruled out and I moved forward with this technique.
Kaartigan began with statement (h):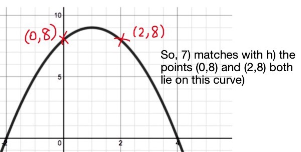
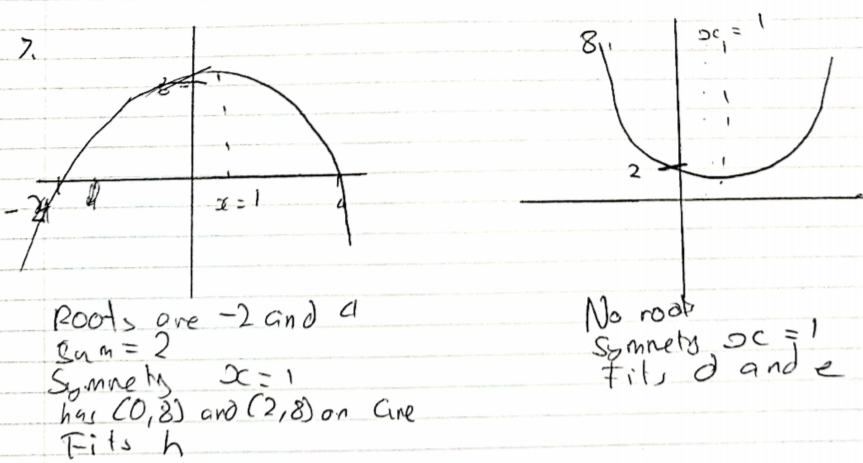
The points (0,8) and (2,8) lie on the graph.
This has to be graph 7. This is because we can eliminate all the graphs which don't have a y-intercept of 8, as the point (0,8) has to be part of the curve. This leaves only graphs 5 and 7. As the gradient of [curve] 5 is decreasing, it cannot go through (2,8). Therefore this statement matches with graph 7.
Deeya began with statement (d) and then continued:
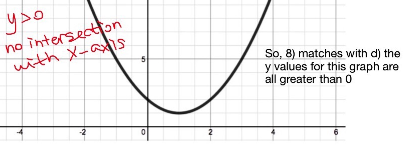
Graph 8 matches to statement (d) because for all y values to be greater than 0, no coordinates should be below the line y=0 as this line separates the positive y coordinates from the negative y coordinates. The only graph drawn this way is graph 8.
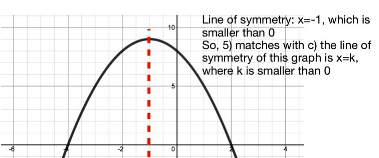
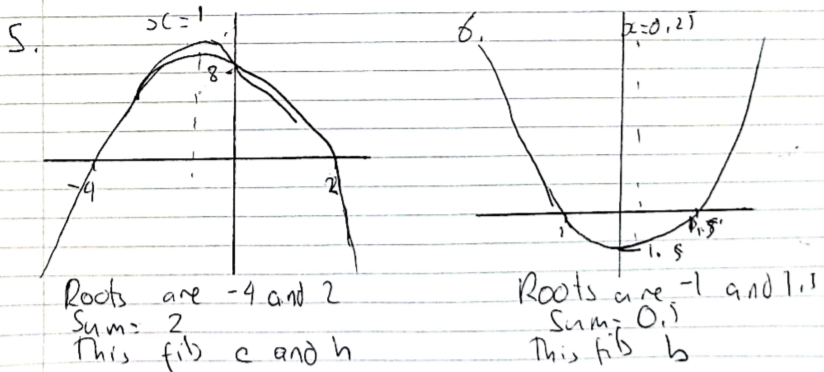
Graph 5 matches statement (c) as the turning point of the graph has the coordinates (-1,9). The line of symmetry must go through the turning point of the graph, and in order for k<0 the x value must be negative. The only graph with a negative x coordinate of the turning point is graph 5.
To match up the statements (b), (g) and (i), I wrote down the coordinates of the roots of the remaining graphs and added them together.
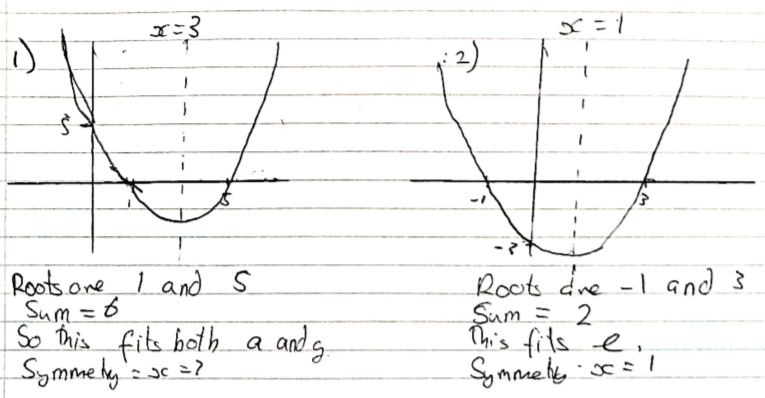
G1 (1,0) + (5,0) = 6
G2 (-1,0) + (3,0) = 2
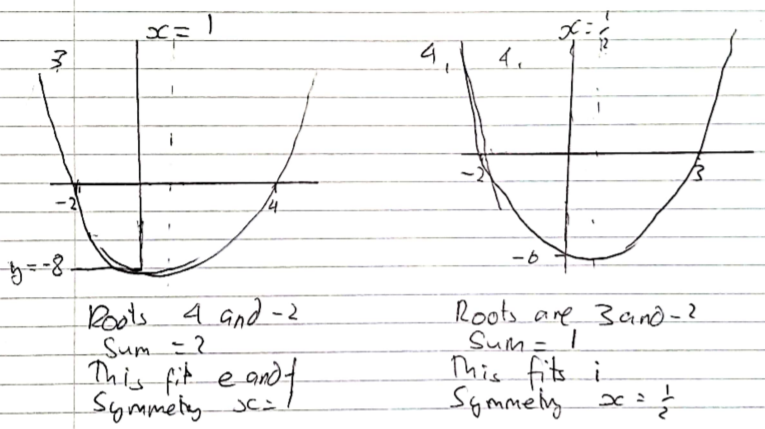
G3 (-2,0) + (4,0) = 2
G4 (-2,0) + (3,0) = 1
G6 (-1,0) + (1.5,0) = 0.5
G9 no roots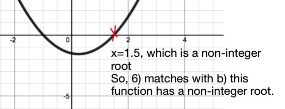
Graph 6 must match statement (b) as it is the only graph with a decimal root.
Graph 1 matches statement (g) as 1+5=6.
Graph 4 matches statement (i) because -2+3=1 which is the only odd sum among the other root sums.
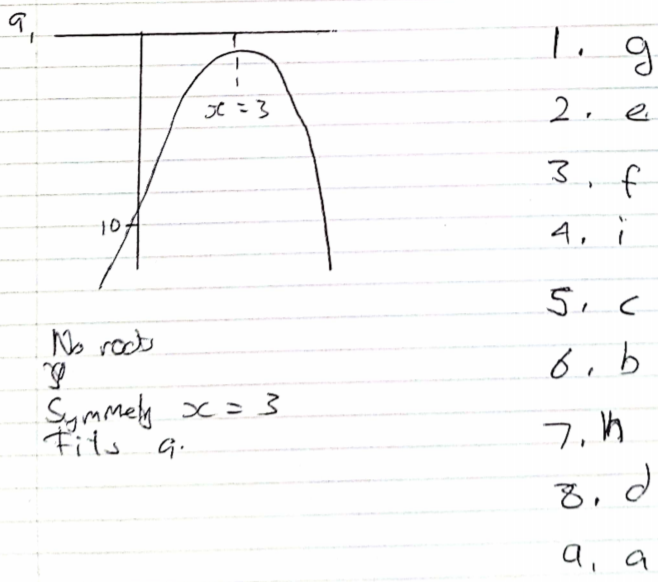
Graph 9 matches to statement (a) as it is the only graph left with an x coordinate of 3 at its turning point, so it is the only graph left with its line of symmetry x=3
This leaves statements (e) (line of symmetry is x=1) and (f) (constant term is -8) to be matched with graphs 2 and 3.
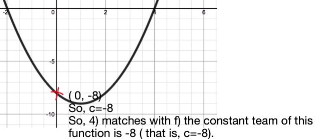 Kaartigan explained why (f) matches graph 3:
The constant term is referring to the y-intercept, so the curve must have a y-intercept of -8.
Therefore (e) matches graph 2.
Mohamed from the London Academy of Excellence Tottenham and Mahdi found the roots, intercept and the line of symmetry of each graph and used this to match the graphs to the statements. This is Mohamed's work:
Zain and Joel from Hymers College in the UK used the same method. Zain wrote:
At first, I listed the statements and put the possible graphs that could match with them.
(a) Could be 1 or 9
(b) Could be 8 or 9 or 6
(c) Could be 5
(d) Could be 8
(e) Could be 2 or 3 or 7 or 8
(f) Could be 3
(g) Could be 1
(h) Could be 7
(i) Could be 4
Joel explained the method in more detail:
For (a), I realised that the turning point must have an x value which equals to 3. The two graphs which had this were 1 and 9.
(b) stated that the graph it corresponds to has a non-integer root, which only corresponds to 6, which has the roots, -1 and 1.5.
(c) states that its graph has a line of symmetry which is x=k, where k<0. This shows that the vertex must be on the left side on the y-axis, and the only graph which has this is 5.
(d) says that all y values must be above 0 and the only graph with this is 8.
(e) says that the vertex of its graph line on x=1, but multiple graphs fit this statement. 2, 3, 7 and 8 all have a turning point on the line x=1 but since we have already used 8, we can rule it out. This leaves 2,3 and 7.
Next comes (f), which shows that its graph has a constant term of -8, so this shows that its roots must make a product of -8. The three graphs which have this are 3 and 7 (which have the roots -2 and 4) and 5 (which have the roots -4 and 2). We can rule out 5 as we have already used it and so are left with 7 and 3.
(g) states it has a graph which the sum of its roots is 6. The only one which makes this statement true is 1 (which has roots 1 and 5).
(h) says the two points (0,8) and (2,8) lie on its curve and the only graph with that is 7.
Lastly, we have (i) which says the sum of its roots is an odd number. As there are only two roots in a quadratic graph, we must find the graph with an even and odd root. This will make a sum of an odd number and the only graph that fits this requirement is 4.
After going through all statements, we must go back to the ones we haven't solved. These would be (a), (e) and (f).
Going back to (a) we see we have either 1 or 9, but as 1 has already been used, we get the answer 9.
Next, we have (e) which we got the answers 7, 3 and 2. 7 is already used so we are left with 3 and 2 but cannot make a decision between the two.
We will have to go on to (f), which matched with 7 and 3. Again we can rule out 7, as it has already been used, which leaves us with 3 as the answer.
Going back to (e), we can rule out 3 which leaves us with 2.
This leaves us with the answers (a)-9, (b)-6, (c)-5, (d)-8, (e)-2, (f)-3, (g)-1, (h)-7 and (i)-4.
Eric from Lakeridge in the USA suggested finding equations for all of the graphs:
I mean, all of these can be bashed out if we find 3 points on the parabola. At that point we can just substitute for x and y, and from that we have a 3 variable system of equations for a, b, and c.
That sounds complicated, but Isabella from England did find the equation of each graph. Here is Isabella's work for graph 1:
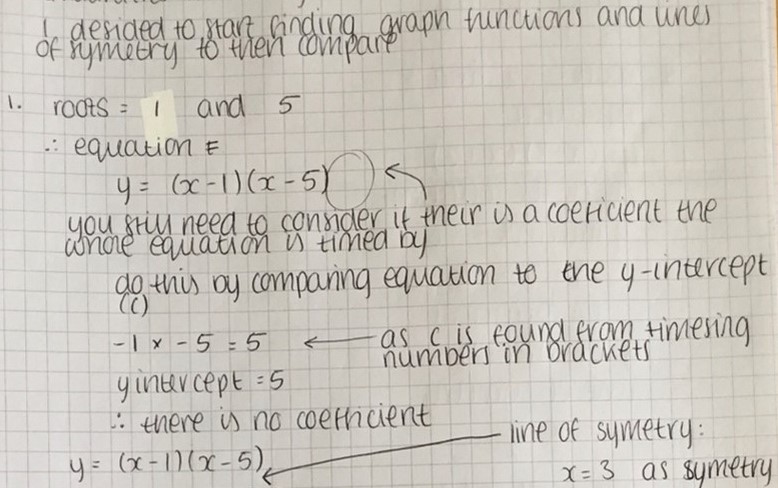
Click here to see Isabella's work for all of the graphs.
Well done also to Moses from Woodbridge School in England and Varun from International School of Geneva - Campus des Nations in Switzerland who sent in correct results.