Skip over navigation


Using a tree diagram
The students at the language school can be represented using a tree diagram, as shown: The missing percentages can then be calculated:
So a total of 45% + 17.5% = 62.5% of students graduate.
45% have never been to France and graduated, so we need to find 45% as a percentage of 62.5%: $$\frac{45}{62.5}=\frac{?}{100}\\
\Rightarrow \frac {90}{125}=\frac{?}{100}\\
\Rightarrow \frac {90\times100}{125}=?\\
\Rightarrow \frac{18\times5\times25\times4}{5\times25}=?\\
\Rightarrow 18\times4=?$$
So 72% of students who graduate have never been to France.
Using a two-way table
The students at the language school can be represented using a two-way table, as shown:
 A total 62.5% of students graduate, of whom 45% have never been to France, so we need to find 45% as a percentage of 62.5%: $$\frac{45}{62.5}=\frac{?}{100}\\
\Rightarrow \frac {90}{125}=\frac{?}{100}\\
\Rightarrow \frac {90\times100}{125}=?\\
\Rightarrow \frac{18\times5\times25\times4}{5\times25}=?\\
\Rightarrow 18\times4=?$$
So 72% of students who graduate have never been to France.
Using a Venn diagram
The students at the language school can be represented using a Venn diagram, as shown: The missing percentages can be calculated:

45% have never been to school and graduated, so we need to find 45% as a percentage of 62.5%: $$\frac{45}{62.5}=\frac{?}{100}\\
\Rightarrow \frac {90}{125}=\frac{?}{100}\\
\Rightarrow \frac {90\times100}{125}=?\\
\Rightarrow \frac{18\times5\times25\times4}{5\times25}=?\\
\Rightarrow 18\times4=?$$
So 72% of students who graduate have never been to France.


Dropouts
Age 14 to 16
ShortChallenge Level 
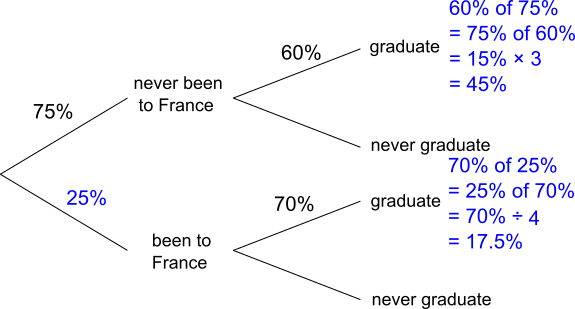
Using a tree diagram
The students at the language school can be represented using a tree diagram, as shown:
So a total of 45% + 17.5% = 62.5% of students graduate.
45% have never been to France and graduated, so we need to find 45% as a percentage of 62.5%: $$\frac{45}{62.5}=\frac{?}{100}\\
\Rightarrow \frac {90}{125}=\frac{?}{100}\\
\Rightarrow \frac {90\times100}{125}=?\\
\Rightarrow \frac{18\times5\times25\times4}{5\times25}=?\\
\Rightarrow 18\times4=?$$
So 72% of students who graduate have never been to France.
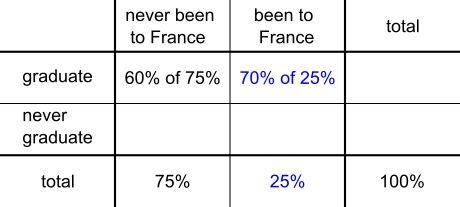
Using a two-way table
The students at the language school can be represented using a two-way table, as shown:
60% of 75% can be found as half of 75% plus 10% of 75% = 37.5% + 7.5% = 45%,
or as 75% of 60% = 3 $\times$ 15% = 45%.
70% of 25% can be found as half of 25% plus a fifth of 25% = 12.5% + 5% = 17.5%,
or as 25% of 70% = 70% $\div$ 4 = 17.5%.
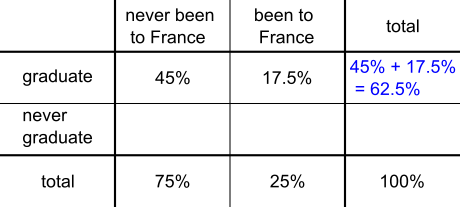
Then we can find the total percentage of students who graduate:
or as 75% of 60% = 3 $\times$ 15% = 45%.
70% of 25% can be found as half of 25% plus a fifth of 25% = 12.5% + 5% = 17.5%,
or as 25% of 70% = 70% $\div$ 4 = 17.5%.
Then we can find the total percentage of students who graduate:
\Rightarrow \frac {90}{125}=\frac{?}{100}\\
\Rightarrow \frac {90\times100}{125}=?\\
\Rightarrow \frac{18\times5\times25\times4}{5\times25}=?\\
\Rightarrow 18\times4=?$$
So 72% of students who graduate have never been to France.
Using a Venn diagram
The students at the language school can be represented using a Venn diagram, as shown:
So a total of 45% + 17.5% = 62.5% of students graduate.
45% have never been to school and graduated, so we need to find 45% as a percentage of 62.5%: $$\frac{45}{62.5}=\frac{?}{100}\\
\Rightarrow \frac {90}{125}=\frac{?}{100}\\
\Rightarrow \frac {90\times100}{125}=?\\
\Rightarrow \frac{18\times5\times25\times4}{5\times25}=?\\
\Rightarrow 18\times4=?$$
So 72% of students who graduate have never been to France.
You can find more short problems, arranged by curriculum topic, in our short problems collection.
You may also like
In a Box
Chris and Jo put two red and four blue ribbons in a box. They each pick a ribbon from the box without looking. Jo wins if the two ribbons are the same colour. Is the game fair?
Chances Are
Which of these games would you play to give yourself the best possible chance of winning a prize?