Skip over navigation


Answer: $y=x-6$ comes closer
Shortest distance is $\sqrt{18}=3\sqrt2 = 4.243$
First sketch, or plot, both graphs
To plot
To sketch
Some arrows to the origin have been added to show distances to $(0,0).$ The shortest distance is when the arrow makes a right-angle with the line.
This is true because the shortest arrow is along a line of symmetry. Click below to see a short proof involving circles.
All of the points on the red circle are the same distance from $(0,0)$, and that distance is the length of the red arrow, which is the radius of the circle. This is the same for each colour.
Each circle crosses the line twice, but at the shortest possible distance, the circle would only just touch the line. So the line would be a tangent to the circle.
The tangent is perpendicular to the radius it touches, so the arrow at the line's closest point to $(0,0)$ will be perpendicular to the graph.
The line $y=2x-10$ has gradient $2$
Perpendicular line has gradient $-\frac12$
$\therefore $ the line from $(0,0$) to $A$ has equation $y= -\frac12x$
So at $A$, $2x-10=-\frac12x\Rightarrow4x-20=-x\Rightarrow 5x=20\Rightarrow x=4$ and so $y=-2$
But also, $-2=4-6$ so $A$ is also on the line $y=x-6$
$B$ is the point on the line $y=x-6$ which is closest to $(0,0)$, so it must be closer to $(0,0)$ than $A$ is (they are not the same point because the arrow from $(0,0)$ to $B$ is perpendicular to $y=x-6$)
So the line $y=x-6$ comes closer to the origin than the line $y=2x-10$ does.
What is this shortest distance?
The arrow from $(0,0)$ to $B$ has gradient $-1$, and so its equation will be $y=-x.$
At B: $-x=x-6$
$ \Rightarrow 6=2x$
$\Rightarrow 3=x$
So $y=-x=-3$
Pythagoras' Theorem:
$3^2+3^2=?^2$
$\Rightarrow 18 = ?^2$
$\Rightarrow ? = \sqrt{18}$
(which is equal to $3\sqrt 2$ or $4.243$ to 3 decimal places).


Closer to Home
Age 14 to 16
ShortChallenge Level 
Answer: $y=x-6$ comes closer
Shortest distance is $\sqrt{18}=3\sqrt2 = 4.243$
First sketch, or plot, both graphs
To plot
For $y=2x-10$:
For $y=x-6$:
| $x$ | $0$ | $1$ | $2$ | $3$ |
| $y$ | $-10$ | $-8$ | $-6$ | $-4$ |
For $y=x-6$:
| $x$ | $0$ | $1$ | $2$ | $3$ |
| $y$ | $-6$ | $-5$ | $-4$ | $-3$ |
To sketch
Find the $x$ and $y$ intercepts of each graph:
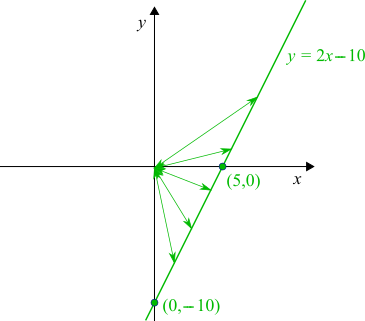
For $y=2x-10$: $x=0\Rightarrow y=0-10=-10$ so $(0,-10)$ is on the graph
$y=0\Rightarrow 0=2x-10\Rightarrow 2x=10\Rightarrow x=5$so $(5,0)$ is on the graph.
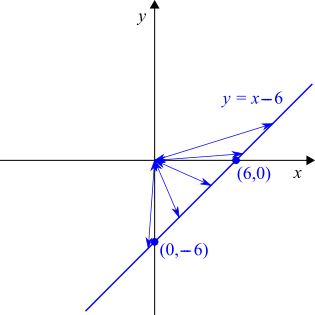
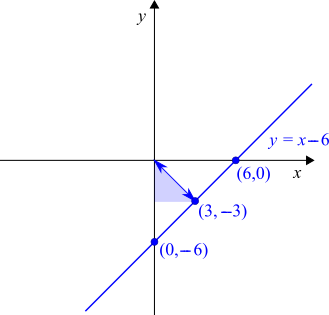
For $y=x-6$: $x=0\Rightarrow y=0-6=-6$ so $(0,-6)$ is on the graph
$y=0\Rightarrow 0=x-6\Rightarrow x=6$ so $(6,0)$ is on the graph.
For $y=2x-10$: $x=0\Rightarrow y=0-10=-10$ so $(0,-10)$ is on the graph
$y=0\Rightarrow 0=2x-10\Rightarrow 2x=10\Rightarrow x=5$so $(5,0)$ is on the graph.
For $y=x-6$: $x=0\Rightarrow y=0-6=-6$ so $(0,-6)$ is on the graph
$y=0\Rightarrow 0=x-6\Rightarrow x=6$ so $(6,0)$ is on the graph.
Some arrows to the origin have been added to show distances to $(0,0).$ The shortest distance is when the arrow makes a right-angle with the line.
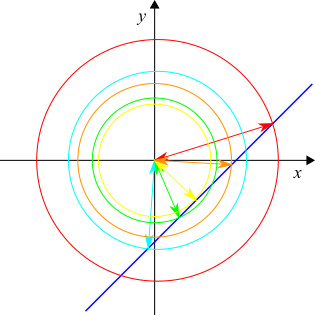
This is true because the shortest arrow is along a line of symmetry. Click below to see a short proof involving circles.
All of the points on the red circle are the same distance from $(0,0)$, and that distance is the length of the red arrow, which is the radius of the circle. This is the same for each colour.
Each circle crosses the line twice, but at the shortest possible distance, the circle would only just touch the line. So the line would be a tangent to the circle.
The tangent is perpendicular to the radius it touches, so the arrow at the line's closest point to $(0,0)$ will be perpendicular to the graph.
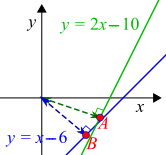
The line $y=2x-10$ has gradient $2$
Perpendicular line has gradient $-\frac12$
$\therefore $ the line from $(0,0$) to $A$ has equation $y= -\frac12x$
So at $A$, $2x-10=-\frac12x\Rightarrow4x-20=-x\Rightarrow 5x=20\Rightarrow x=4$ and so $y=-2$
But also, $-2=4-6$ so $A$ is also on the line $y=x-6$
$B$ is the point on the line $y=x-6$ which is closest to $(0,0)$, so it must be closer to $(0,0)$ than $A$ is (they are not the same point because the arrow from $(0,0)$ to $B$ is perpendicular to $y=x-6$)
So the line $y=x-6$ comes closer to the origin than the line $y=2x-10$ does.
What is this shortest distance?
The arrow from $(0,0)$ to $B$ has gradient $-1$, and so its equation will be $y=-x.$
At B: $-x=x-6$
$ \Rightarrow 6=2x$
$\Rightarrow 3=x$
So $y=-x=-3$
Pythagoras' Theorem:
$3^2+3^2=?^2$
$\Rightarrow 18 = ?^2$
$\Rightarrow ? = \sqrt{18}$
(which is equal to $3\sqrt 2$ or $4.243$ to 3 decimal places).
You can find more short problems, arranged by curriculum topic, in our short problems collection.
You may also like
Doesn't Add Up
In this problem we are faced with an apparently easy area problem, but it has gone horribly wrong! What happened?
Parabolic Patterns
The illustration shows the graphs of fifteen functions. Two of them have equations y=x^2 and y=-(x-4)^2. Find the equations of all the other graphs.
Exploring Cubic Functions
Quadratic graphs are very familiar, but what patterns can you explore with cubics?