Skip over navigation


Thousands of People
Age 14 to 16
Challenge Level 

In the land of Mathia, there are six towns, Algeby, Bracketon, Costown, Divisham, Ethorpe and Factorbridge. They are shown on the map below:
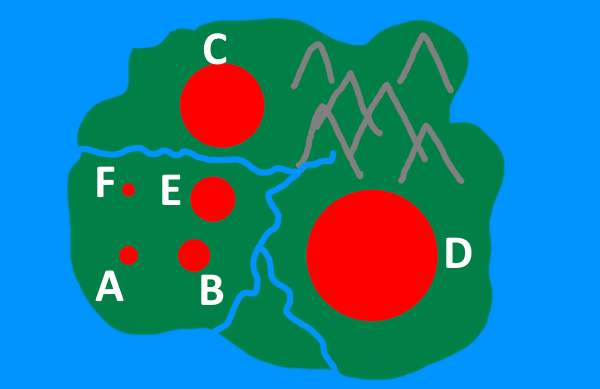
Algeby has 1000 inhabitants.
If each circle on the map represents the population of the town, can you estimate the population of the other five towns?
Once you've had a go at estimating, click below to read on.
If we choose units so that A has a radius of 1, then the radius of each circle is shown in the table below:
Assuming the population of each town is proportional to the area of each circle, can you work out the actual populations of towns B, C, D, E and F?
Sometimes, when presenting data in this way, someone might choose to make the radius proportional to the population rather than the area. Compare your estimates to the actual populations, and to what the populations would be if the diagram used radius instead of area.
Which do you think is a better choice for representing the data - radius, or area?
When representing data, it is good practice to make sure the areas of regions used to convey numerical data are in proportion with the size of the number being represented.
Have a look in a newspaper or online for charts, diagrams and infographics where figures are misrepresented by using uneven scales, angled three-dimensional pie charts, or other representations that distort area. Why might someone choose to represent their data in this way?
You might like to try Where Are You Flying? next.
This resource is part of the collection Statistics - Maths of Real Life
Algeby has 1000 inhabitants.
If each circle on the map represents the population of the town, can you estimate the population of the other five towns?
Once you've had a go at estimating, click below to read on.
If we choose units so that A has a radius of 1, then the radius of each circle is shown in the table below:
| Town | Radius |
|---|---|
| A | 1 |
| B | 1.7 |
| C | 4.5 |
| D | 7 |
| E | 2.4 |
| F | 0.7 |
Assuming the population of each town is proportional to the area of each circle, can you work out the actual populations of towns B, C, D, E and F?
Sometimes, when presenting data in this way, someone might choose to make the radius proportional to the population rather than the area. Compare your estimates to the actual populations, and to what the populations would be if the diagram used radius instead of area.
Which do you think is a better choice for representing the data - radius, or area?
When representing data, it is good practice to make sure the areas of regions used to convey numerical data are in proportion with the size of the number being represented.
Have a look in a newspaper or online for charts, diagrams and infographics where figures are misrepresented by using uneven scales, angled three-dimensional pie charts, or other representations that distort area. Why might someone choose to represent their data in this way?
You might like to try Where Are You Flying? next.
This resource is part of the collection Statistics - Maths of Real Life