Skip over navigation


Show the map:
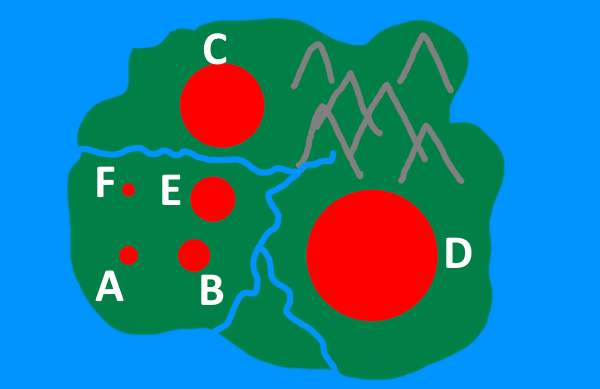
"If Town A has 1000 inhabitants, and a larger circle means more people live there, can you estimate the populations of the other towns?"
You may wish to give students a cop of the map. Once they have written down their estimates, share with them the table showing the radius of each circle:
"If the number of inhabitants is proportional to the area of each circle, can you work out the population of each town?"
Give students some time to perform the calculations in groups. Then bring the class together and discuss whether their estimates assumed proportionality to the area or the radius. Finally, share examples of data presentations where areas are distorted to skew perceptions of the data, and discuss why people might choose to present data in this way.
Why might people deliberately choose to represent data in a less transparent way?
Thousands of People
Age 14 to 16
Challenge Level 

Why do this problem?
This problem gives students the opportunity to investigate the way area distortions can be used to present data in a misleading fashion.Possible approach
Show the map:
"If Town A has 1000 inhabitants, and a larger circle means more people live there, can you estimate the populations of the other towns?"
You may wish to give students a cop of the map. Once they have written down their estimates, share with them the table showing the radius of each circle:
| Town | Radius |
|---|---|
| A | 1 |
| B | 1.7 |
| C | 4.5 |
| D | 7 |
| E | 2.4 |
| F | 0.7 |
"If the number of inhabitants is proportional to the area of each circle, can you work out the population of each town?"
Give students some time to perform the calculations in groups. Then bring the class together and discuss whether their estimates assumed proportionality to the area or the radius. Finally, share examples of data presentations where areas are distorted to skew perceptions of the data, and discuss why people might choose to present data in this way.
Key questions
Which is a better choice for representing relative proportions - radius (length) or area?Why might people deliberately choose to represent data in a less transparent way?