An Introduction to Polar Coordinates
In one sense it might seem odd that the first way we are taught to represent the position of objects in mathematics is using Cartesian coordinates when this method of location is not the most natural or the most convenient. For a start, you have to use negative as well as positive numbers to describe all the points on the plane and you have to create a grid (well axes) to use as a
reference.
When you ask a child where they left their ball they will say "just over there'' and point. They are describing (albeit very roughly) a distance "just'' and a direction "over there'' (supported by a point or a nod of the head). When you ask someone where their town is they often say things like "about $30$ miles north of London''. Again, a distance and direction. It is not very often that someone
gives the latitude and longitude of their town!
The use of a distance and direction as a means of describing position is therefore far more natural than using two distances on a grid. This means of location is used in polar coordinates and bearings.
The polar coordinates of a point describe its position in terms of a distance from a fixed point (the origin) and an angle measured from a fixed direction which, interestingly, is not "north'' (or up on a page) but "east'' (to the right). That is in the direction $Ox$ on Cartesian axes.
So:
In the plane we choose a fixed point $O$, known as "the pole''.
Then we choose an axis $Ox$ through the pole and call it the "polar axis".
The Relationship Between Polar and Cartesian Coordinates
Imagine a point $P$ which has polar coordinates $(r,\theta)$. Let's try to use this information to give the Cartesian coordinates of $P$ We can drop a perpendicular from the point $P$ to $Ox$ meeting $Ox$ at $Q$. The lengths of $OQ$ and $OP$ represent the $x$ and $y$ coordinates, in Cartesian form, so we just need to find these two distances.
$$\begin{eqnarray} PQ &=& r \sin \theta \\ OQ &=& r \cos \theta \end{eqnarray}$$
Therefore the Cartesian coordinates of $P$ are $(r \sin \theta, r \cos \theta)$
Now let's work the other way:
We start with a Cartesian coordinate system.
We will take the Cartesian coordinates of $P$ as $(x,y)$.
Now we are trying to find $r$ and $\theta$ in terms of $x$ and $y$.
$$r = \sqrt{(x^2 + y^2)}$$
Now we need $\theta$ such that $x = r \cos \theta$ and $y = r \sin \theta$.
It is tempting to say that $\tan\theta = \frac{y}{x}$ but there is a danger in doing this that you might end up with the wrong value of $\theta$ because of the signs of the trigonometric ratios in each quadrant.
For example:
If $P$ were the point $(-2,-2)$ you would obtain a value for $\tan \theta = 1$ and you would not know whether $\theta = 45^\circ (\frac{\pi}{4}^c)$ or $225^\circ (\frac{3\pi}{2}^c)$!!
By using the signs of $\sin\theta$ and $\cos\theta$, you can be sure you have the angle in the correct quadrant.
So let's end by using this coordinate system. It would be good to try out some equations and look at their graphs (polar plots).
Let's look at some examples:
Consider the graph:
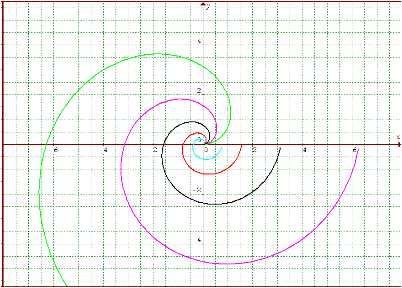
$r= \theta$
This has a spiral shape (each point moves out from the centre as the angle grows).
The diagram below shows graphs of $r= a\theta$ for different values of $a$, can you work out what they are?
Now its your turn. A graphical calculator or graphing package would be very helpful!
What would the series of graphs
$r=1, r=2, r=3, $... look like?
How about $r = 2a(1 + \cos\theta )$ for different values of $a$? These graphs are called cardioids by the way.
Answers:
$$\begin{eqnarray} \mbox{D }\rightarrow(60,0)\\ \mbox{E }\rightarrow(30, 270)\\ \mbox{C }\rightarrow(120, 225)\\ \mbox{A }\rightarrow(90, 90)\\ \mbox{F }\rightarrow(60,60)\\ \mbox{B }\rightarrow(120, 180) \end{eqnarray}$$ And $$\begin{eqnarray} (60,0)\rightarrow(60,0)\\ (30, 270)\rightarrow(30, \frac{3\pi}{2})\\ (120, 225)\rightarrow(120, \frac{5\pi}{4})\\ (90, 90)\rightarrow(90, \frac{\pi}{2})\\
(60,60)\rightarrow(60,\frac{\pi}{3})\\ (120, 180)\rightarrow(120,\pi) \end{eqnarray}$$
Scrunch it up to make a fan round a point, or . . . .
. . . . how to use an xy plot to help visualise the polar plot
But as a polar plot $r = 5\sin 2\theta$ is: