Or search by topic
Number and algebra
Geometry and measure
Probability and statistics
Working mathematically
Advanced mathematics
For younger learners
Speeding Up, Slowing Down


Speeding Up, Slowing Down printable sheet
Take a look at the interactivity below which shows regular polygons "rolling" along the horizontal surface. It leaves a trace of the path of the dot and on the graph it records the speed of the travelling dot.
Experiment by positioning the dot at the centre of the polygons, at one of the vertices or at the centre of one of the sides of the polygons and explore how this affects the speed / time graph.
Challenge:
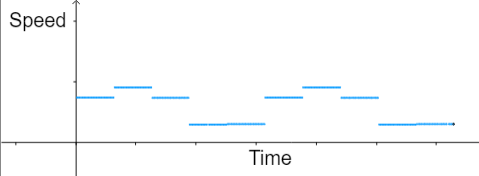
Can you now work out what produced the following speed / time graph?
Can you work out how many sides the polygon had and where the dot was placed?
Try to explain how you worked it out.

Related Collections
You may also like
Speedy Sidney
Two trains set off at the same time from each end of a single straight railway line. A very fast bee starts off in front of the first train and flies continuously back and forth between the two trains. How far does Sidney fly before he is squashed between the two trains?
Illusion
A security camera, taking pictures each half a second, films a cyclist going by. In the film, the cyclist appears to go forward while the wheels appear to go backwards. Why?
Walk and Ride
How far have these students walked by the time the teacher's car reaches them after their bus broke down?

