Skip over navigation


There are thirty children in Class 5. All the first part of the summer term they had been doing a project collecting data about themselves and making all sorts of lists, charts and graphs to present it.
Now it is June and they are going to present all they have done in the project to the whole school. There is double excitement in the classroom that day because it is also one of the children's birthdays.
Presenting the Project
Age 7 to 11
Challenge Level 

Presenting the Project
There are thirty children in Class 5. All the first part of the summer term they had been doing a project collecting data about themselves and making all sorts of lists, charts and graphs to present it.
Now it is June and they are going to present all they have done in the project to the whole school. There is double excitement in the classroom that day because it is also one of the children's birthdays.
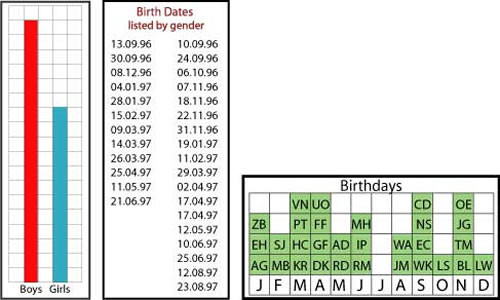
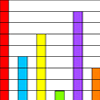
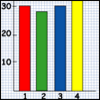
Here is some of the work they have done:
On what day did Class 5 present their work?
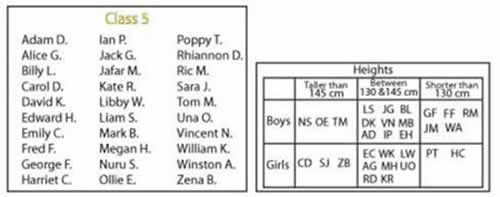
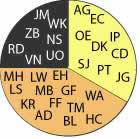
Here are some more charts and posters made by Class 5 for their project.
What information can you find out about the child whose birthday it was on project day?
There are twins in this class. What information can you find out about them?
Why do this problem?
This problem requires learners to use the different forms of data to answer questions. It is made harder by the fact that they will need to look at more than one chart/table/graph in order to answer a single question.
Possible approach
The individual charts are not too difficult to interpret and so a good way into this activity might be to ask some introductory questions about a few of them in turn, just concentrating on one at a time.
At a basic level, this might involve just checking that the class know what M, T, W etc stand for in the calendar and similarly what J, F, M etc mean. You might also want to ask whether there are more boys or more girls in this class. These initial questions will enable the group to become more familiar with the data without the problem itself becoming trivial.
After this introduction learners could work in pairs on the problem on a computer or from a printed sheet so that they are able to talk through their ideas with a partner.
You may find it useful to have larger copies of the charts to project or have on the board. Here are pdfs each containing an enlarged image:
Key questions
Which graphs do you think you need to look at to answer that question?
What do you think M, T, W etc/ J, F, M etc/ ZB, EH, AG etc stand for?
What days of the week will the presentation day not be on?
How many birthdays are there in June? What days of the week are they on?
Can you find out any children who have the same birthdays?
Possible extension
Learners could collect similar data from the class and make their own charts, graphs etc.Possible support
Suggest doing The Pet Graph instead which has much less information.You may also like
The Pet Graph
Tim's class collected data about all their pets. Can you put the animal names under each column in the block graph using the information?
How Big Are Classes 5, 6 and 7?
Use the two sets of data to find out how many children there are in Classes 5, 6 and 7.
Real Statistics
Have a look at this table of how children travel to school. How does it compare with children in your class?