Or search by topic
Number and algebra
Geometry and measure
Probability and statistics
Working mathematically
Advanced mathematics
For younger learners
How Big Are Classes 5, 6 and 7?


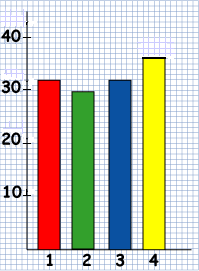
Four pupils from Class 4, Ben, Ali, Katie and Charlene, decided to make graphs of the sizes of the seven classes in the school.
Ben and Ali found out how many children there were in Classes 1, 2 and 3.
Katie and Charlene found about Classes 5, 6 and 7.
Of course they all knew the number of children in Class 4.
Ben and Ali drew a bar chart. It looked like this:

Katie and Charlene drew this pictogram:

Kate and Charlene have forgotten to add a key to their pictogram. What should the key say?
How many children were there altogether in Classes 5, 6 and 7?
You may also like
Graphing Number Patterns
Does a graph of the triangular numbers cross a graph of the six times table? If so, where? Will a graph of the square numbers cross the times table too?
Dining Ducks
Use the information about the ducks on a particular farm to find out which of the statements about them must be true.
You Never Get a Six
Charlie thinks that a six comes up less often than the other numbers on the dice. Have a look at the results of the test his class did to see if he was right.

