Skip over navigation
Cambridge University Faculty of Mathematics NRich logo
menu search
  • Teachers expand_more
    • Early years
    • Primary
    • Secondary
    • Post-16
    • Events
    • Professional development
  • Students expand_more
    • Primary
    • Secondary
    • Post-16
  • Parents expand_more
    • Early Years
    • Primary
    • Secondary
    • Post-16
  • Problem-Solving Schools
  • About NRICH expand_more
    • About us
    • Impact stories
    • Support us
    • Our funders
    • Contact us
  • search

Or search by topic

Number and algebra

  • The Number System and Place Value
  • Calculations and Numerical Methods
  • Fractions, Decimals, Percentages, Ratio and Proportion
  • Properties of Numbers
  • Patterns, Sequences and Structure
  • Algebraic expressions, equations and formulae
  • Coordinates, Functions and Graphs

Geometry and measure

  • Angles, Polygons, and Geometrical Proof
  • 3D Geometry, Shape and Space
  • Measuring and calculating with units
  • Transformations and constructions
  • Pythagoras and Trigonometry
  • Vectors and Matrices

Probability and statistics

  • Handling, Processing and Representing Data
  • Probability

Working mathematically

  • Thinking mathematically
  • Developing positive attitudes
  • Cross-curricular contexts

Advanced mathematics

  • Decision Mathematics and Combinatorics
  • Advanced Probability and Statistics
  • Mechanics
  • Calculus

For younger learners

  • Early Years Foundation Stage

How Big Are Classes 5, 6 and 7?

Age 7 to 11
Challenge Level Yellow star
Primary curriculum
  • Problem
  • Getting Started
  • Student Solutions
  • Teachers' Resources

How Big Are Classes 5, 6 and 7?

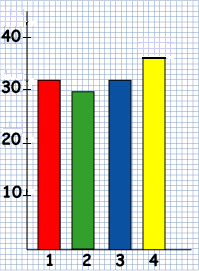
Four pupils from Class 4, Ben, Ali, Katie and Charlene, decided to make graphs of the sizes of the seven classes in the school.

Ben and Ali found out how many children there were in Classes 1, 2 and 3.
Katie and Charlene found about Classes 5, 6 and 7.
Of course they all knew the number of children in Class 4.

Ben and Ali drew a bar chart. It looked like this:

Katie and Charlene drew this pictogram:

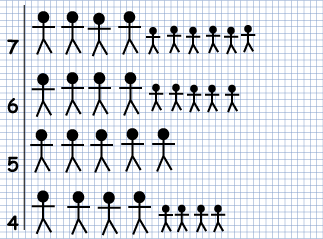
Kate and Charlene have forgotten to add a key to their pictogram. What should the key say?

How many children were there altogether in Classes 5, 6 and 7?

Why do this problem?

This problem encourages learners to contrast different ways of representing similar data, and helps to make explicit their interpretation of what the data represents in order to solve the problem. The task will also help children to realise the significance of labels on charts.
 

Possible approach

Tell the story of the problem orally, revealing the two representations on the board. Rather than asking the questions straight away, you could invite the class to look at the two charts and consider what they notice, and what they wonder, perhaps in pairs.
 
You may find that when you bring everyone together again, some learners point out that the key is missing on the pictogram and so once other contributions have been made, you can focus on this part of the challenge.
 
Give out copies of this sheet, which is a copy of the problem, and invite pairs to work on the task.
 
In the final plenary, you could discuss not only the answers to the problem itself, and how these were reached, but also stress why it is important not to leave out the labels on axes of a graph!

Key questions

What is a reasonable number to try?
What can you find out about Class 4 from the bar graph?
Can you work out the number that each figure stands for from the two graphs for Class 4?

Possible extension

Learners could make different graphs and representations of the numbers in the classes in their own school. 

Possible support

Learners might like to try the task The Pet Graph first, which is more straightforward.

You may also like

Graphing Number Patterns

Does a graph of the triangular numbers cross a graph of the six times table? If so, where? Will a graph of the square numbers cross the times table too?

Dining Ducks

Use the information about the ducks on a particular farm to find out which of the statements about them must be true.

You Never Get a Six

Charlie thinks that a six comes up less often than the other numbers on the dice. Have a look at the results of the test his class did to see if he was right.

  • Tech help
  • Accessibility Statement
  • Sign up to our newsletter
  • Twitter X logo

The NRICH Project aims to enrich the mathematical experiences of all learners. To support this aim, members of the NRICH team work in a wide range of capacities, including providing professional development for teachers wishing to embed rich mathematical tasks into everyday classroom practice.

NRICH is part of the family of activities in the Millennium Mathematics Project.

University of Cambridge logo NRICH logo