Skip over navigation
Cambridge University Faculty of Mathematics NRich logo
menu search
  • Teachers expand_more
    • Early years
    • Primary
    • Secondary
    • Post-16
    • Events
    • Professional development
  • Students expand_more
    • Primary
    • Secondary
    • Post-16
  • Parents expand_more
    • Early Years
    • Primary
    • Secondary
    • Post-16
  • Problem-Solving Schools
  • About NRICH expand_more
    • About us
    • Impact stories
    • Support us
    • Our funders
    • Contact us
  • search

Or search by topic

Number and algebra

  • The Number System and Place Value
  • Calculations and Numerical Methods
  • Fractions, Decimals, Percentages, Ratio and Proportion
  • Properties of Numbers
  • Patterns, Sequences and Structure
  • Algebraic expressions, equations and formulae
  • Coordinates, Functions and Graphs

Geometry and measure

  • Angles, Polygons, and Geometrical Proof
  • 3D Geometry, Shape and Space
  • Measuring and calculating with units
  • Transformations and constructions
  • Pythagoras and Trigonometry
  • Vectors and Matrices

Probability and statistics

  • Handling, Processing and Representing Data
  • Probability

Working mathematically

  • Thinking mathematically
  • Developing positive attitudes
  • Cross-curricular contexts

Advanced mathematics

  • Decision Mathematics and Combinatorics
  • Advanced Probability and Statistics
  • Mechanics
  • Calculus

For younger learners

  • Early Years Foundation Stage

PDF

Age 16 to 18
Challenge Level Yellow starYellow starYellow star
  • Problem
  • Getting Started
  • Student Solutions
  • Teachers' Resources

The advantage of using a continuous probability density function to model a set of statistical data is that instead of having to do calculations with all the separate values we can use calculus to find the required results.

The median is the point $t$ in the interval such that $$\text{Prob}\{0 \leq X \leq t\} = \text{Prob}\{t \leq X \leq 3\}$$

The mean of the distribution is $m$, where $$m=\int_0^3x\,\rho(x)\,dx.$$

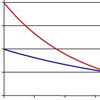
In a discrete distribution the mode is the value that occurs most frequently. In a continuous distribution it is the value where the probability density function takes its maximum value.

You may also like

Scale Invariance

By exploring the concept of scale invariance, find the probability that a random piece of real data begins with a 1.

Into the Exponential Distribution

Get into the exponential distribution through an exploration of its pdf.

PCDF

When can a pdf and a cdf coincide?

  • Tech help
  • Accessibility Statement
  • Sign up to our newsletter
  • Twitter X logo

The NRICH Project aims to enrich the mathematical experiences of all learners. To support this aim, members of the NRICH team work in a wide range of capacities, including providing professional development for teachers wishing to embed rich mathematical tasks into everyday classroom practice.

NRICH is part of the family of activities in the Millennium Mathematics Project.

University of Cambridge logo NRICH logo