Skip over navigation


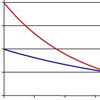
We can estimate the probability of selecting a negative random variable by evaluating the area under the curve in the region of negative x. Approximating this area using a triangle will give us an over-estimate of the actual probability.
Blue Curve: Pr(X< 0) $\approx$ 0.5 x 2 x 0.25 = 0.25
Red Curve: Pr(X< 0) $\approx$ 0.5 x 2 x 0.1 = 0.1
Black Curve: Pr(X< 0) $\approx$ 0.5 x 2 x 0.05 = 0.05
A normal distribution is symmetric about its mean. This allows us to estimate the mean of each distribution by inspection:
$\mu_{Blue}$ = 1
$\mu_{Red}$ = 2
$\mu_{Black}$ = 3
We know that f(x) = $\frac{1}{ \sigma \sqrt{2 \pi}} e^{\frac{-(x-\mu)^2}{2 \sigma ^2}}$
If we evaluate f(x) at x = $\mu$ the exponential will disappear ($e^0 = 1$)
We can then solve for $\sigma$
$f(\mu) = \frac{1}{ \sigma \sqrt{2 \pi}} $
$\sigma =\frac{1}{\sqrt{2 \pi} f(\mu)}$
Evaluating f($\mu$) from the curves and substituting $\mu$ into the expression we find that:
$\mu_{Blue}$ = 1, $\sigma^2_{Blue} = 1$
$\mu_{Red}$ = 2, $\sigma^2_{Red} = 2$
$\mu_{Black}$ = 3, $\sigma^2_{Black} = 3$

Into the Normal Distribution
Age 16 to 18
Challenge Level 

We can estimate the probability of selecting a negative random variable by evaluating the area under the curve in the region of negative x. Approximating this area using a triangle will give us an over-estimate of the actual probability.
Blue Curve: Pr(X< 0) $\approx$ 0.5 x 2 x 0.25 = 0.25
Red Curve: Pr(X< 0) $\approx$ 0.5 x 2 x 0.1 = 0.1
Black Curve: Pr(X< 0) $\approx$ 0.5 x 2 x 0.05 = 0.05
A normal distribution is symmetric about its mean. This allows us to estimate the mean of each distribution by inspection:
$\mu_{Blue}$ = 1
$\mu_{Red}$ = 2
$\mu_{Black}$ = 3
We know that f(x) = $\frac{1}{ \sigma \sqrt{2 \pi}} e^{\frac{-(x-\mu)^2}{2 \sigma ^2}}$
If we evaluate f(x) at x = $\mu$ the exponential will disappear ($e^0 = 1$)
We can then solve for $\sigma$
$f(\mu) = \frac{1}{ \sigma \sqrt{2 \pi}} $
$\sigma =\frac{1}{\sqrt{2 \pi} f(\mu)}$
Evaluating f($\mu$) from the curves and substituting $\mu$ into the expression we find that:
$\mu_{Blue}$ = 1, $\sigma^2_{Blue} = 1$
$\mu_{Red}$ = 2, $\sigma^2_{Red} = 2$
$\mu_{Black}$ = 3, $\sigma^2_{Black} = 3$
You may also like
Scale Invariance
By exploring the concept of scale invariance, find the probability that a random piece of real data begins with a 1.
Into the Exponential Distribution
Get into the exponential distribution through an exploration of its pdf.