Skip over navigation
Cambridge University Faculty of Mathematics NRich logo
menu search
  • Teachers expand_more
    • Early years
    • Primary
    • Secondary
    • Post-16
    • Events
    • Professional development
  • Students expand_more
    • Primary
    • Secondary
    • Post-16
  • Parents expand_more
    • Early Years
    • Primary
    • Secondary
    • Post-16
  • Problem-Solving Schools
  • About NRICH expand_more
    • About us
    • Impact stories
    • Support us
    • Our funders
    • Contact us
  • search

Or search by topic

Number and algebra

  • The Number System and Place Value
  • Calculations and Numerical Methods
  • Fractions, Decimals, Percentages, Ratio and Proportion
  • Properties of Numbers
  • Patterns, Sequences and Structure
  • Algebraic expressions, equations and formulae
  • Coordinates, Functions and Graphs

Geometry and measure

  • Angles, Polygons, and Geometrical Proof
  • 3D Geometry, Shape and Space
  • Measuring and calculating with units
  • Transformations and constructions
  • Pythagoras and Trigonometry
  • Vectors and Matrices

Probability and statistics

  • Handling, Processing and Representing Data
  • Probability

Working mathematically

  • Thinking mathematically
  • Developing positive attitudes
  • Cross-curricular contexts

Advanced mathematics

  • Decision Mathematics and Combinatorics
  • Advanced Probability and Statistics
  • Mechanics
  • Calculus

For younger learners

  • Early Years Foundation Stage

Back Fitter

Age 14 to 18
Challenge Level Yellow starYellow star
Secondary curriculum
  • Problem
  • Getting Started
  • Student Solutions
  • Teachers' Resources

Back Fitter printable sheet


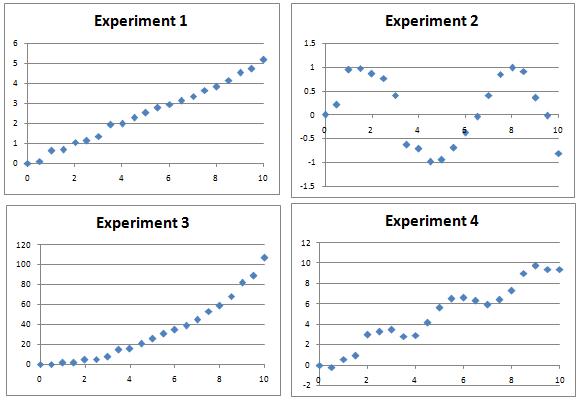
Several experiments were performed and data measured over a period of 10 hours.

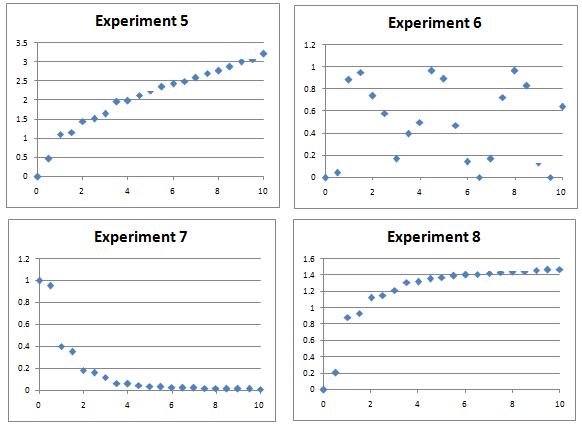
The resulting charts are shown below.

Can you find algebraic equations which closely match the curves, which could be used to predict values of the variables at other times? There might be many possible curves of the right sort of shape by eye, so a numerical plot will be needed to discover the most likely candidates.

The following Office 2003 spreadsheet will allow you easily to compare plots of the likely curves against the actual data - the intention is that you will tackle this problem numerically.

Note: The different sets of experimental data are distinct, so try as many or as few as you like. Fitting all of the sets will present quite a challenge!

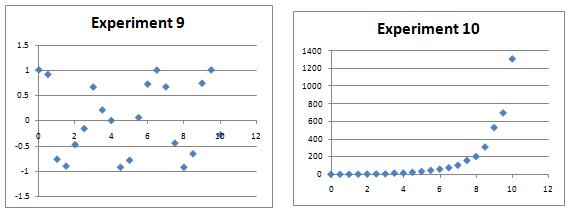
Extension: Whilst there are 'obvious' candidates for each data set, can you find multiple functions which give rise to apparently good matches to some of the data sets? How might you numerically determine which fits are best?


You may also like

Ladder and Cube

A 1 metre cube has one face on the ground and one face against a wall. A 4 metre ladder leans against the wall and just touches the cube. How high is the top of the ladder above the ground?

Growing

Which is larger: (a) 1.000001^{1000000} or 2? (b) 100^{300} or 300! (i.e.factorial 300)

Archimedes and Numerical Roots

The problem is how did Archimedes calculate the lengths of the sides of the polygons which needed him to be able to calculate square roots?

  • Tech help
  • Accessibility Statement
  • Sign up to our newsletter
  • Twitter X logo

The NRICH Project aims to enrich the mathematical experiences of all learners. To support this aim, members of the NRICH team work in a wide range of capacities, including providing professional development for teachers wishing to embed rich mathematical tasks into everyday classroom practice.

NRICH is part of the family of activities in the Millennium Mathematics Project.

University of Cambridge logo NRICH logo