Or search by topic
Number and algebra
Geometry and measure
Probability and statistics
Working mathematically
Advanced mathematics
For younger learners
Ramping it Up


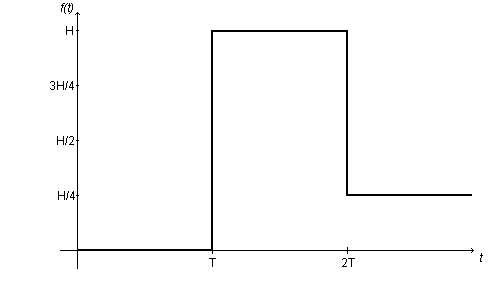
At a time T, a car mounts a curb of height $H$, and its front suspension undergoes a sudden change. At a time 2T, the car drops down the other side of the curb to $\frac{1}{4}H$. It is suggested that the graph of this process is as given as a function $f(t)$ above.
Try to work out the graph of $f $ '$(t)$ against $t$. What parts make sense and what parts don't? Could you alter the graph of $f(t)$ slightly to make the derivative function make more sense?
Next imagine that a car drives at a steady $20$ km h$^{-1}$ over a concrete block of height $10$cm and rectangular cross section of width $50$ cm. Make a mathematical model of the height of the front suspension over time. Be clear as to your assumptions and make a clear note of any possible refinements to your model.
What does your model say about the derivative of the height over time?
What is the maximum G-force the suspension of a car is likely to be subjected to in normal use?
On a physical note, think about the implications that this sort of modelling process might have on the design of shock-absorbers for cars.
You may also like
Ball Bearings
If a is the radius of the axle, b the radius of each ball-bearing, and c the radius of the hub, why does the number of ball bearings n determine the ratio c/a? Find a formula for c/a in terms of n.
Overarch 2
Bricks are 20cm long and 10cm high. How high could an arch be built without mortar on a flat horizontal surface, to overhang by 1 metre? How big an overhang is it possible to make like this?
Cushion Ball
The shortest path between any two points on a snooker table is the straight line between them but what if the ball must bounce off one wall, or 2 walls, or 3 walls?

