Patterns of Inflection


A First Look
In the first graph below, we have a cubic with two turning points and one point of inflection.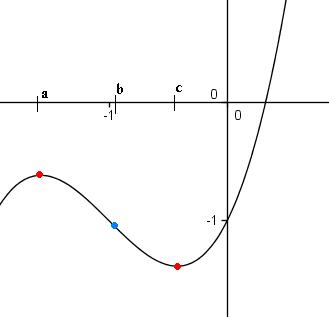
The blue dot indicates a point of inflection and the red dots indicate maximum/minimum points. A change of inflection occurs when the second derivative of the function changes sign.
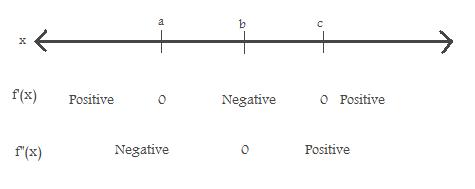
To show there is a blue point in between the two red points, we consider a gradient table of the above curve (try this with any similar looking cubic if you are not sure):
We then consider a quintic, as shown below. This has four turning points and three points of inflection, marked with red and blue dots respectively.
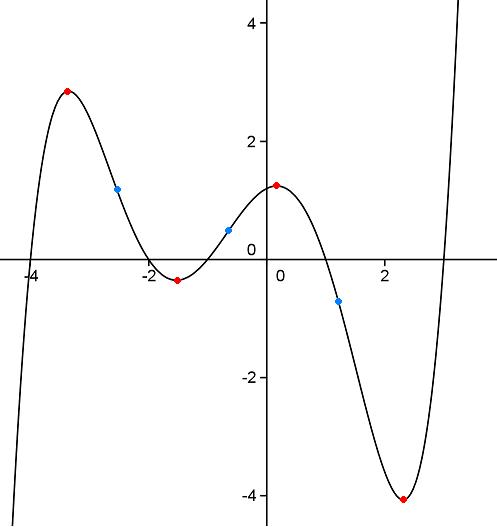
Call the black points $I_1, I_2, I_3$ going from right to left. We note that $I_1, I_3$, mark a change from concave to covex, while the other point of inflexion, $I_2$, marks a change from convex to concave.
A General Idea
We postulate that if there is a maximum followed by a minimum, or a minimum followed by a maximum, then there must be a point of inflection in between.
We prove this by looking at a general cubic equation f(x) like in the first graph, and treating its derivative as a new function. This new function is zero at points a and c.
Thus the derivative function must have a turning point, marked b, between points a and c, and we call this the point of inflection. The existence of b is a consequence of a theorem discovered by Rolle.
By looking at the second graph also, we conjecture that if there are n turning points, then there will be n-1 points of inflection. For example, in the first graph we had 2 turning points and 1 point of inflection. Can you find a way to prove this?
A Note on Concavity and Convexity
We use the term concavity, to describe the second derivative of the curve. If $\frac {\mathrm{d}^2y}{\mathrm{d}x^2}\geq 0$ then we call that part of the curve convex, and if $\frac {\mathrm{d}^2y}{\mathrm{d}x^2}\leq 0$ then we call that part of the curve concave.
Visually, we can see these definitions by drawing a straight line between any two points on the curve. The function is convex if this line is above the curve, and concave if below.
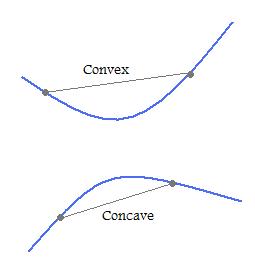
The point of inflection occurs when this line crosses to the other side of the curve. That is, the curve will alternate between convex and concave with the points of change-over being points of inflection.
Sometimes stationary points and points of inflection coincide, as in the function $y=x^3$. However this is not always the case, as in the first example.
Two Cubics
We now consider our conjecture in terms of the two cubic equations.
1) $y=3x^3-6x^2+9x+11$
This has derivative $\frac{\mathrm{d}y}{\mathrm{d}x}=9x^2-12x+9$, and second derivative $\frac{\mathrm{d}^2y}{\mathrm{d}x^2}=18x-12$.
To find the stationary points, we set $\frac{\mathrm{d}y}{\mathrm{d}x}=0$
$\Rightarrow x=2\pm i\surd5$, so our turning points are imaginary.
To find the points of inflection, we set $\frac{\mathrm{d}^2y}{\mathrm{d}x^2}=0$
$\Rightarrow x={2\over 3}$, so we have one real inflection point.
As expected, we have one more stationary point than point of inflection. Plot the graph yourself to see what a cubic looks like when the stationary points are imaginary.
2) $y=2x^3-5x^2-4x$
To find the stationary points, we set $\frac{\mathrm{d}y}{\mathrm{d}x}=0$
$\Rightarrow \frac{\mathrm{d}y}{\mathrm{d}x}=6x^2-10x-4=0 \Rightarrow x={-1\over 3}, 2$
And to find the points of inflection, we set $\frac{\mathrm{d}^2y}{\mathrm{d}x^2}=0$
$\Rightarrow \frac{\mathrm{d}^2y}{\mathrm{d}x^2}=12x-10=0 \Rightarrow x={5\over 6}$
As expected, we have one more stationary point than point of inflection, and this time all our points are real. To determine the order of our stationary points, we calculate the second derivative at $x={-1\over 3}, 2$.
$\frac{\mathrm{d}y}{\mathrm{d}x}=14$ at $x=2$ and $\frac{\mathrm{d}y}{\mathrm{d}x}=-14$ at $x=\frac{-1}{3}$. So we have a maximum followed by a minimum.
General Cubics
Consider the function $f(x)=ax^3+bx^2+cx+d$
This has derivatives $\frac{\mathrm{d}y}{\mathrm{d}x}=3ax^2+2bx+c$ and $\frac{\mathrm{d}^2y}{\mathrm{d}x^2}=6ax+2b$.
If we set $\frac{\mathrm{d}y}{\mathrm{d}x}=0$, we have at most two distinct stationary points which can be found using the quadratic formula. And we have one point of inflection, which can be found by setting
$\frac{\mathrm{d}^2y}{\mathrm{d}x^2}=0 \Rightarrow x= \frac{-b}{3a}$
Now if $a> 0$ then for large negative values of x the function will have negative values. This means the first turning point will have to be a maximum (draw a few curves if you are not convinced).
Thus the curve has one point of inflection which is in between maximum and minimum points (not necessarily real), the order of which is determined by the value of a.
Similarly if $a< 0$ then for large negative values of x the function will have positive values, and so the first turning point will be a minimum.
We leave you to look at further patterns for polynomials of order 4 and greater!
You may also like
Folium of Descartes
Investigate the family of graphs given by the equation x^3+y^3=3axy for different values of the constant a.
Witch of Agnesi
Sketch the members of the family of graphs given by y = a^3/(x^2+a^2) for a=1, 2 and 3.