Branching Processes and Extinction

This is the final destination in our series on population dynamics. Well done for making it this far!
Branching Processes
Following on from the basic branching processes introduction, we now calculate the expected number of individuals at the nth generation.
As in the above example, let $Z_n$ be the number of individuals in generation n, and X be a random variable describing the number of offspring an individual has, with $E[X]=\mu$ and $Var[X]=\sigma^2$
$$ \begin{align*} \therefore E[Z_n] & = G'_n(1) \\ &= G'_{n-1} \Big (G(1) \Big)G'(1) \\ &= G'_{n-1}(1)G'(1) \\ &= E[Z_{n-1}] \mu \\ &= \mu^2 E[Z_{n-2}] =... \\ &= \mu^n E[Z_0] \\ &= \mu^n \end{align*} $$
Clearly the eventual population size is highly dependent on the value of $\mu$
- if $\mu < 1$ then $E[Z_n] \rightarrow 0$
- if $\mu = 1$ then $E[Z_n] \rightarrow 1$
- if $\mu > 1$ then $E[Z_n] \rightarrow \infty $
So if each individual is expected to have more than one offspring, then the population will increase. If each individual is expected to have either one or no offspring, then the population will remain constant or decrease and eventually die out.
Question:
Why do elephants not die out, if the above comment on mean family size holds? What are the limitations of our model in representing the reproductive lifespan of an elephant?
Probability of Extinction
By evaluating the mean, we see that ultimate extinction is certain only when the mean family size is $\mu \leq 1$.
To find this probability exactly, we let the probability of extinction at the nth generation be $\theta_n=P(Z_n=0)$ . So the probability of ultimate extinction is $\theta = lim_{n \to \infty} \theta_n=lim_{n \to \infty} P(X_n=0)$ .
$$ \begin{align*} \theta_n & = G_n(0) \\ & = G_{n-1} \Big(G(0)\Big) \\ &= G\Big(G\big(...(s)...\big)\Big) \\ &= G\Big(G_{n-1}(s)\Big) \\ &= G(\theta_{n-1}) \end{align*} $$
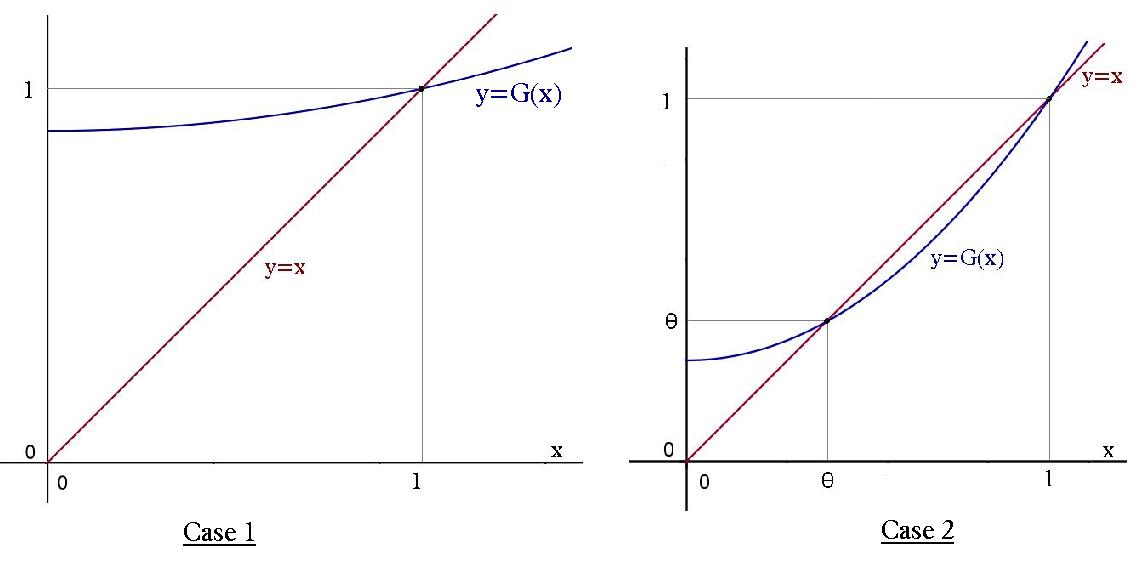
So as $n \rightarrow \infty$ , we have $\theta_n\rightarrow \theta$ and $G(\theta_{n-1}) \rightarrow G(\theta)$ . And so we can find $\theta$ by solving $$\theta=G(\theta)$$
Now there may be other roots to this equation, so we show $\theta$ is the smallest by supposing $\alpha$ is also a root. Then $\theta_1=G(0) \leq G(\alpha)=\alpha \Rightarrow \theta_2=G(\theta_1) \leq G(\alpha)=\alpha$
And so proceeding by induction, $\theta =lim_{n \to \infty} \theta_n \leq \alpha$ , which shows $\theta$ is indeed the smallest non-negative root.
The dependence of $\theta$ on the value of the mean family size, is shown in the diagrams below. The first case being $\mu \leq 1$ and the second case $\mu > 1$ .
Example:
In the previous elephant example, we now solve for $\theta$ in the equation $$ \begin{align*} \theta & = G(\theta) \\ &= (1-p^n)+p^n \theta\\ \theta(1-p^n) &= (1-p^n) \\ \therefore \theta &=1 \end{align*}$$
Related Collections
You may also like
Ball Bearings
If a is the radius of the axle, b the radius of each ball-bearing, and c the radius of the hub, why does the number of ball bearings n determine the ratio c/a? Find a formula for c/a in terms of n.
Overarch 2
Bricks are 20cm long and 10cm high. How high could an arch be built without mortar on a flat horizontal surface, to overhang by 1 metre? How big an overhang is it possible to make like this?
Cushion Ball
The shortest path between any two points on a snooker table is the straight line between them but what if the ball must bounce off one wall, or 2 walls, or 3 walls?