Skip over navigation
Elliot from Wilson's School sent the following explanations:
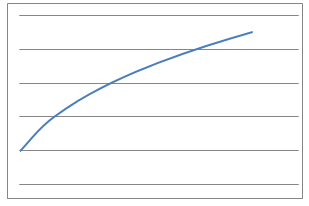
The radius-number of pumps graph of the balloon links to the 1st graph, as the radius would gradually increase by less as the volume increases.
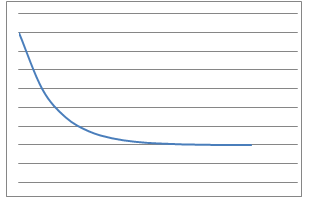
The temperature-time graph for the tea links to the 2nd graph, as the temperature would decrease less as it cools down.
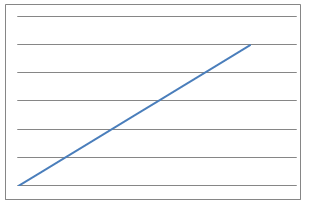
The odometer reading-time graph links to the 3rd graph, as the car is moving at a constant speed, so the distance would also increase constantly.
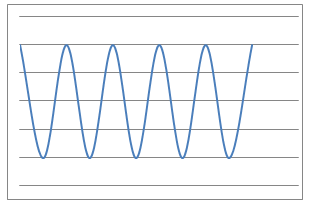
The height-distance graph for the bicycle valve links with the 4th graph, as the valve's height would increase and decrease as the wheel rotates around.
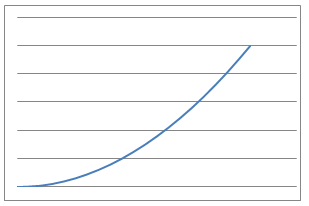
The distance fallen-time graph links to graph 5, as you would accelerate, meaning your distance fallen would gradually increase by more.
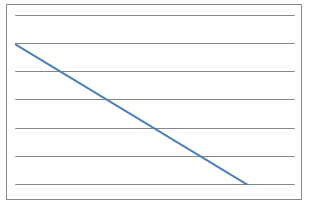
The volume-time graph for the water links to graph 6, as the water is sucked out at a constant rate, so the volume would decrease at a constant rate.
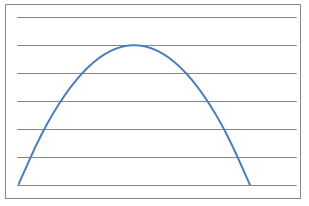
The height-time graph for the tennis ball would be graph 7, as the height would increase when you throw it, then gradually stop increasing and decrease again as it falls.
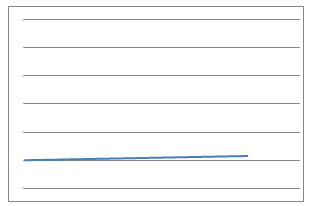
The metres-inches graph links to graph 8, as the number of inches would be much greater than the number of metres, creating a very shallow straight line.
Niharika came up with some processes of her own that each graph could represent.
Linden explained the shape of each graph and found the correct equations.


Or search by topic
Number and algebra
Geometry and measure
Probability and statistics
Working mathematically
Advanced mathematics
For younger learners
What's That Graph?
Age 14 to 18
Challenge Level 


- Problem
- Getting Started
- Student Solutions
- Teachers' Resources
Elliot from Wilson's School sent the following explanations:

The radius-number of pumps graph of the balloon links to the 1st graph, as the radius would gradually increase by less as the volume increases.

The temperature-time graph for the tea links to the 2nd graph, as the temperature would decrease less as it cools down.

The odometer reading-time graph links to the 3rd graph, as the car is moving at a constant speed, so the distance would also increase constantly.

The height-distance graph for the bicycle valve links with the 4th graph, as the valve's height would increase and decrease as the wheel rotates around.

The distance fallen-time graph links to graph 5, as you would accelerate, meaning your distance fallen would gradually increase by more.

The volume-time graph for the water links to graph 6, as the water is sucked out at a constant rate, so the volume would decrease at a constant rate.

The height-time graph for the tennis ball would be graph 7, as the height would increase when you throw it, then gradually stop increasing and decrease again as it falls.

The metres-inches graph links to graph 8, as the number of inches would be much greater than the number of metres, creating a very shallow straight line.
Niharika came up with some processes of her own that each graph could represent.
Linden explained the shape of each graph and found the correct equations.
You may also like
Ball Bearings
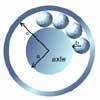
If a is the radius of the axle, b the radius of each ball-bearing, and c the radius of the hub, why does the number of ball bearings n determine the ratio c/a? Find a formula for c/a in terms of n.
Far Horizon
An observer is on top of a lighthouse. How far from the foot of the lighthouse is the horizon that the observer can see?
Air Routes
Find the distance of the shortest air route at an altitude of 6000 metres between London and Cape Town given the latitudes and longitudes. A simple application of scalar products of vectors.

