Or search by topic
Number and algebra
Geometry and measure
Probability and statistics
Working mathematically
Advanced mathematics
For younger learners
The Domesday Project


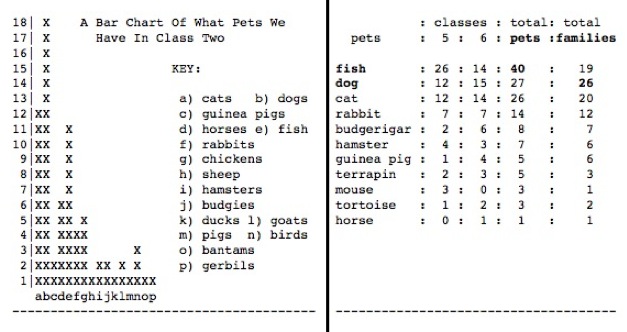
Above are two sets of data that were gathered by school children in 1986 for what was called the Domesday Project. This project took place throughout the U.K. celebrating 900 years since the Domesday Book. You can find out more about it here.
In the data you see what two schools found out about the pets owned by some of the children. The Domesday Project took place in the early days of computers and so there were not many ways to display the information.
Here is a collection of seven such surveys which you can download as a pdf (data.pdf). These seven include the two above. Have a good look at them. You could focus on just the two above or on all seven.
What did the various school children find out?
These seven schools were all from very different areas of the UK. Does that surprise you? How might that have affected the data?
What differences do you notice in the ways that the data is displayed?
Which survey do you think is presented in the best way? Why?
Which survey do you think is not presented in a helpful way? Why?
You could do a similar survey in your class and compare the results.
You may also like
Match the Matches
Decide which charts and graphs represent the number of goals two football teams scored in fifteen matches.
In the Playground
What can you say about the child who will be first on the playground tomorrow morning at breaktime in your school?
The Car That Passes
What statements can you make about the car that passes the school gates at 11am on Monday? How will you come up with statements and test your ideas?

