Skip over navigation
Cambridge University Faculty of Mathematics NRich logo
menu search
  • Teachers expand_more
    • Early years
    • Primary
    • Secondary
    • Post-16
    • Events
    • Professional development
  • Students expand_more
    • Primary
    • Secondary
    • Post-16
  • Parents expand_more
    • Early Years
    • Primary
    • Secondary
    • Post-16
  • Problem-Solving Schools
  • About NRICH expand_more
    • About us
    • Impact stories
    • Support us
    • Our funders
    • Contact us
  • search

Or search by topic

Number and algebra

  • The Number System and Place Value
  • Calculations and Numerical Methods
  • Fractions, Decimals, Percentages, Ratio and Proportion
  • Properties of Numbers
  • Patterns, Sequences and Structure
  • Algebraic expressions, equations and formulae
  • Coordinates, Functions and Graphs

Geometry and measure

  • Angles, Polygons, and Geometrical Proof
  • 3D Geometry, Shape and Space
  • Measuring and calculating with units
  • Transformations and constructions
  • Pythagoras and Trigonometry
  • Vectors and Matrices

Probability and statistics

  • Handling, Processing and Representing Data
  • Probability

Working mathematically

  • Thinking mathematically
  • Developing positive attitudes
  • Cross-curricular contexts

Advanced mathematics

  • Decision Mathematics and Combinatorics
  • Advanced Probability and Statistics
  • Mechanics
  • Calculus

For younger learners

  • Early Years Foundation Stage

The Domesday Project

Age 7 to 11
Challenge Level Yellow star
Primary curriculum
  • Problem
  • Getting Started
  • Student Solutions
  • Teachers' Resources

The Domesday Project

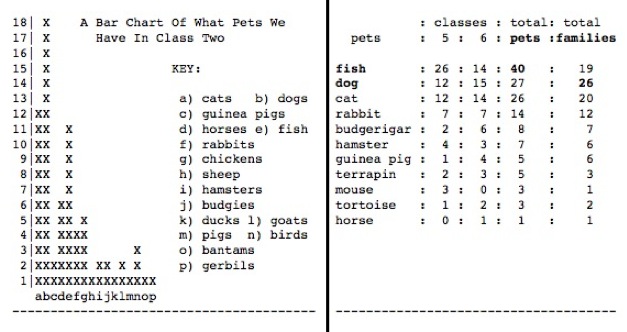
Above are two sets of data that were gathered by school children in 1986 for what was called the Domesday Project.   This project took place throughout the U.K. celebrating 900 years since the Domesday Book. You can find out more about it here. 

In the data you see what two schools found out about the pets owned by some of the children. The Domesday Project took place in the early days of computers and so there were not many ways to display the information. 

Here is a collection of seven such surveys which you can download as a pdf (data.pdf). These seven include the two above. Have a good look at them. You could focus on just the two above or on all seven.

What did the various school children find out?

These seven schools were all from very different areas of the UK.  Does that surprise you?  How might that have affected the data?

What differences do you notice in the ways that the data is displayed?

Which survey do you think is presented in the best way?  Why?

Which survey do you think is not presented in a helpful way?  Why?

You could do a similar survey in your class and compare the results.

Why do this problem?

This activity provides an opportunity to engage pupils in fruitful discussion about meaningful data. It can be linked with history since the data were recorded before people had sophisticated computer programmes for displaying information as we do today. It gives a forum for a whole group or class discussion, thereby providing a situation where pupils need to listen carefully to what others are saying, and follow the thinking behind what has been said. 
 

Possible approach

You could begin by telling the class a bit about the Domesday Project and then give out copies of the seven sets of data to small groups or pairs (data.pdf).  (The data could be cut into seven separate cards.)  Give learners time to explore and interpret the data, prompting where necessary using the questions in the problem. 
 
There are likely to be two main points for discussion:  what the data tell us and the ways the data has been presented.  Some children might begin to make hypotheses and draw tentative conclusions from the data, perhaps also thinking about how the data might be different if similar surveys were conducted now.  Others may comment on the way the classes in used their wordprocessing skills to display the data they had collected.  Encourage pupils to compare the merits of the different ways of presenting the data.  Which do they think is most effective and why?
 

Key questions

Why do you say that?
What area of the UK do you think would give these data?
How might the results of these surveys be different now, compared with 1986?
How would you choose to display these data?  Why?


Possible extension

Encourage learners to choose one set of data and represent it in a different, more effective way.


Possible support

Some may need one-to-one help in understanding the different representations.  You could begin by asking a question such as "Can you tell me something you have learned from this chart/table?" as this should help you gauge the difficulties the pupil might be having.

You may also like

Match the Matches

Decide which charts and graphs represent the number of goals two football teams scored in fifteen matches.

In the Playground

What can you say about the child who will be first on the playground tomorrow morning at breaktime in your school?

The Car That Passes

What statements can you make about the car that passes the school gates at 11am on Monday? How will you come up with statements and test your ideas?

  • Tech help
  • Accessibility Statement
  • Sign up to our newsletter
  • Twitter X logo

The NRICH Project aims to enrich the mathematical experiences of all learners. To support this aim, members of the NRICH team work in a wide range of capacities, including providing professional development for teachers wishing to embed rich mathematical tasks into everyday classroom practice.

NRICH is part of the family of activities in the Millennium Mathematics Project.

University of Cambridge logo NRICH logo