Skip over navigation


Or search by topic
Number and algebra
Geometry and measure
Probability and statistics
Working mathematically
Advanced mathematics
For younger learners
If the World Were a Village
Age 5 to 11
Challenge Level 


- Problem
- Getting Started
- Student Solutions
- Teachers' Resources
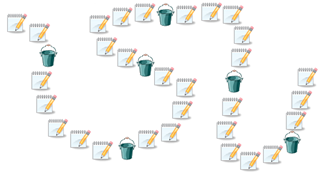
Here are some other examples which might get you thinking ...
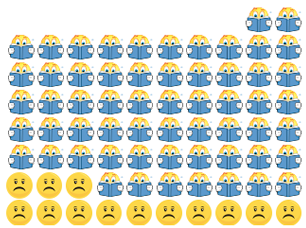
Adults in the village who can and can't read:

Children in the village who do and don't go to school:

What different ways of showing the data can you think of?
Is a pictogram always the best?
You may also like
Ladybird Count
Some children were playing a game. Make a graph or picture to show how many ladybirds each child had.
How Big Are Classes 5, 6 and 7?
Use the two sets of data to find out how many children there are in Classes 5, 6 and 7.

