Skip over navigation
Cambridge University Faculty of Mathematics NRich logo
menu search
  • Teachers expand_more
    • Early years
    • Primary
    • Secondary
    • Post-16
    • Events
    • Professional development
  • Students expand_more
    • Primary
    • Secondary
    • Post-16
  • Parents expand_more
    • Early Years
    • Primary
    • Secondary
    • Post-16
  • Problem-Solving Schools
  • About NRICH expand_more
    • About us
    • Impact stories
    • Support us
    • Our funders
    • Contact us
  • search

Or search by topic

Number and algebra

  • The Number System and Place Value
  • Calculations and Numerical Methods
  • Fractions, Decimals, Percentages, Ratio and Proportion
  • Properties of Numbers
  • Patterns, Sequences and Structure
  • Algebraic expressions, equations and formulae
  • Coordinates, Functions and Graphs

Geometry and measure

  • Angles, Polygons, and Geometrical Proof
  • 3D Geometry, Shape and Space
  • Measuring and calculating with units
  • Transformations and constructions
  • Pythagoras and Trigonometry
  • Vectors and Matrices

Probability and statistics

  • Handling, Processing and Representing Data
  • Probability

Working mathematically

  • Thinking mathematically
  • Developing positive attitudes
  • Cross-curricular contexts

Advanced mathematics

  • Decision Mathematics and Combinatorics
  • Advanced Probability and Statistics
  • Mechanics
  • Calculus

For younger learners

  • Early Years Foundation Stage

Our Sports

Age 7 to 11
Challenge Level Yellow star
Primary curriculum
  • Problem
  • Student Solutions
  • Teachers' Resources

This activity was somewhat different to the usual ones and would probably be explored when the class is doing something about data collection. If this happens later in the year still feel free to send in solutions. We had the following from someone who unfortunately left no name or school!


To tell other classes what sport is most liked in our class you could have a vote.Then we could make a graph to show them. For example if half the class voted for the high jump and nobody voted for the $100$ metre sprint, it would be shown on the graph. It could also be shown in a table or a bar chart. In the bar chart it would show diffrent coloured bars for different sports. In a table it would be shown by drawing $1,2,3,4$.


Lance from Concord Elementary School in the US sent in this well constructed and useful pie chart. Well Done!.


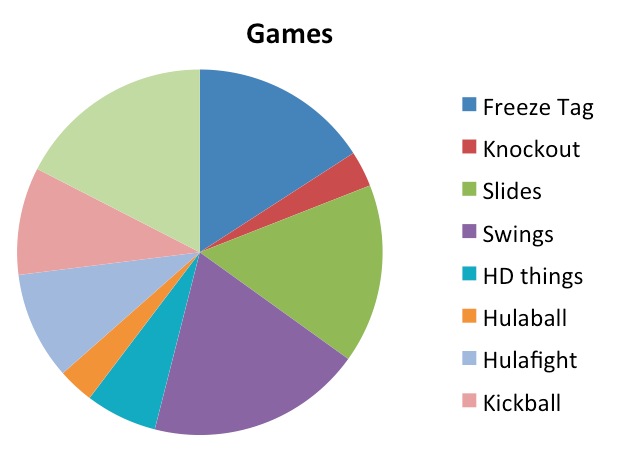
This pie chart shows very clearly a lot of information, you might look at this as an incentive for a discussion, thank you Lance.


You may also like

Graphing Number Patterns

Does a graph of the triangular numbers cross a graph of the six times table? If so, where? Will a graph of the square numbers cross the times table too?

Dining Ducks

Use the information about the ducks on a particular farm to find out which of the statements about them must be true.

How Big Are Classes 5, 6 and 7?

Use the two sets of data to find out how many children there are in Classes 5, 6 and 7.

  • Tech help
  • Accessibility Statement
  • Sign up to our newsletter
  • Twitter X logo

The NRICH Project aims to enrich the mathematical experiences of all learners. To support this aim, members of the NRICH team work in a wide range of capacities, including providing professional development for teachers wishing to embed rich mathematical tasks into everyday classroom practice.

NRICH is part of the family of activities in the Millennium Mathematics Project.

University of Cambridge logo NRICH logo