Skip over navigation


This can be rearranged to give:
Drawn as a graph, with H on the vertical axis and D on the horizontal axis, provided h and d are held constant, this should give a straight line through the origin, with gradient h/d.
Pinhole Camera
Age 11 to 14
Challenge Level 

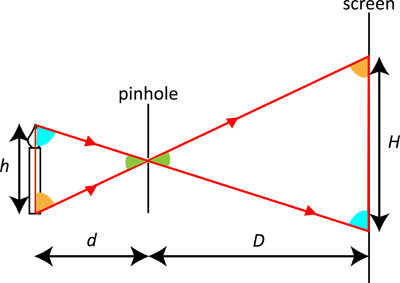
The diagram shows an object (a candle), the pinhole and the screen.
The candle has height h, and is a distance d from the pinhole.
The pinhole is a distance D from the screen.
The image is height H on the screen.
The red lines show the path of rays of light from the candle to the image.
You should notice that the image is upside down - can you see why?
As the length D is increased (keeping d constant) the height H should increase proportionately.
(Imagine what would happen to the rays of light if you moved the screen away from the pinhole.)
If you draw a graph of H against D it should be a straight line.
The two red triangles made by the rays of light, the candle and the screen are similar.
One of the conditions for similarity is equal angles, which are marked in the same colour.
The two green angles are the same because they are enclosed within the same straight lines (opposite angles).
The two turquoise angles are the same because the lines marked h and H are parallel, and these two angles are therefore equal (alternating angles).
The two orange angles are equal for the same reason (alternating angles).
Because the two red triangles are similar, the sides and the heights of the triangles are in proportion, so:
$$ \frac{H}{h} = \frac{D}{d} $$
This can be rearranged to give:
$$ H = \frac{h}{d}D $$
Drawn as a graph, with H on the vertical axis and D on the horizontal axis, provided h and d are held constant, this should give a straight line through the origin, with gradient h/d.