Skip over navigation


Now and Then
Age 7 to 11
Challenge Level 

Max and Charlie from Corpus Christi School in Australia sent in the following predictions for 2016 and now that the Games are over I've added in the actual results alongside Max and Charlie's:
100m -> 9.5s Actual was 9.81s
200m -> 18.7s Actual was 19.78s
400m -> 40.12s Actual was 43.03s
800m -> 104.2s Actual was 102.15s
1500m -> 211.4s Actual was 230s
Thuong from ISM school sent in the following:
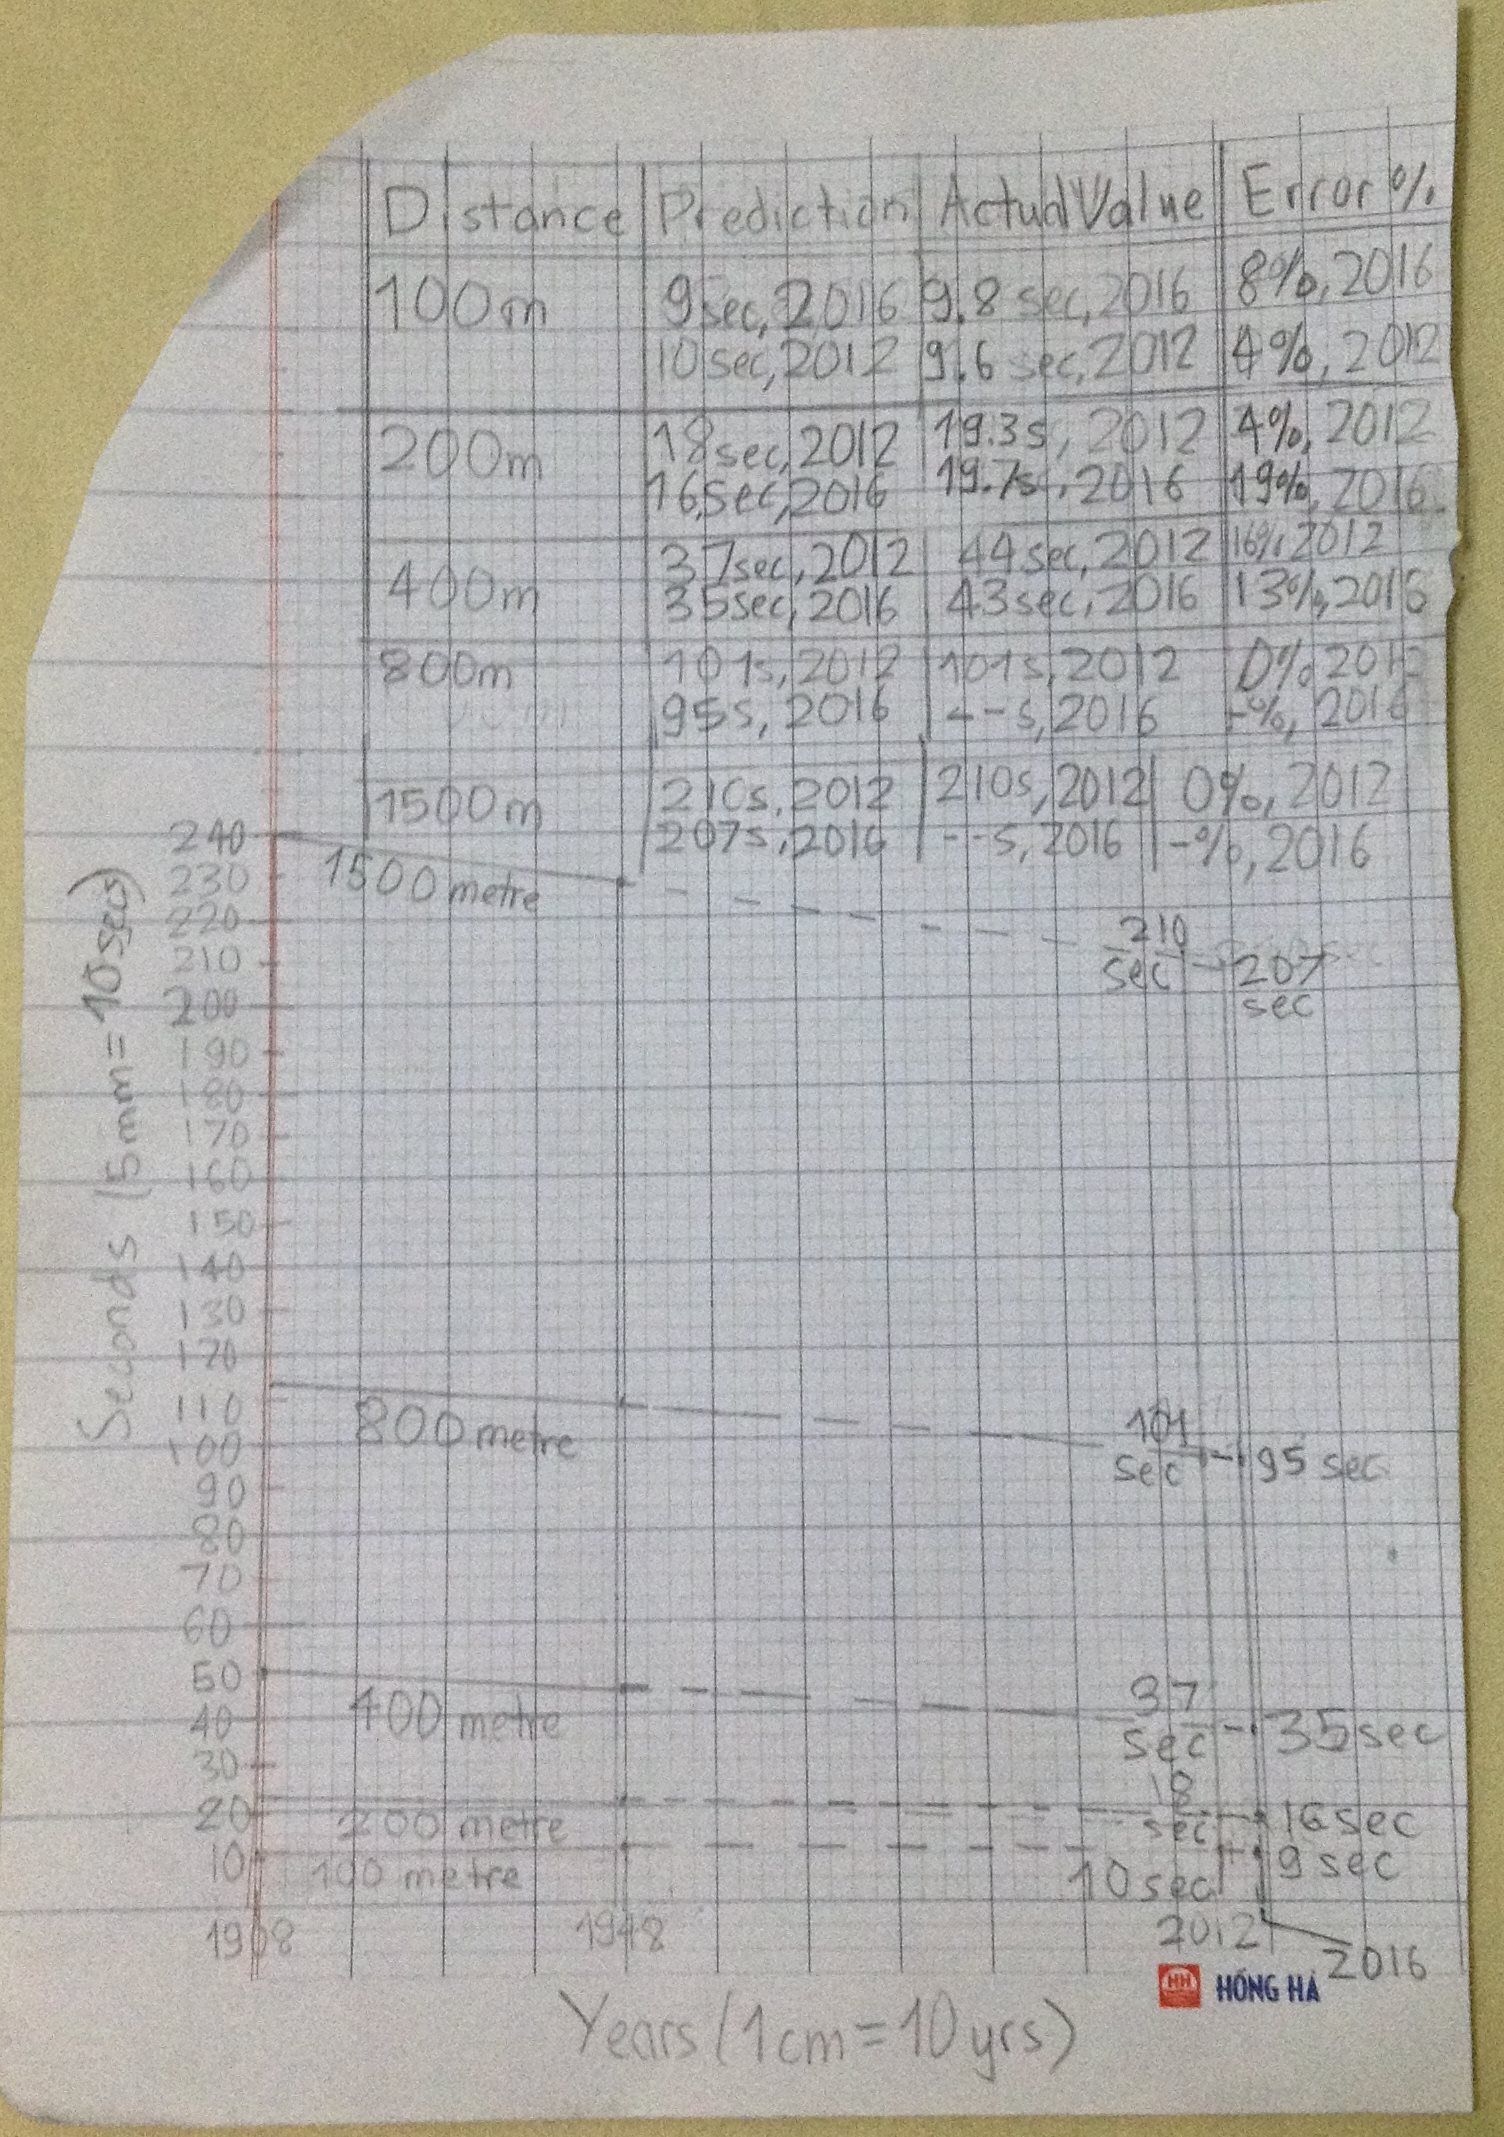
It came to me that the seconds taken should decrease with the years, so I decided to draw a line graph and draw a line between the values of 1908 and 1948. Then, I drew the line and stopped it when it was directly above the year I wanted (either 2012 or 2016). After doing this, I would be able to see my prediction. I knew that my prediction wouldn't be exact, but in this way, I could estimate where the values would be around. I then looked at the actual values and calculated the error percentage. With this data, I made a chart to display all of the info I had.
About the results:
I think that my predictions were pretty accurate, but I wonder why the 400m prediction's error percentage is so much higher than the others' error percentages. I believe that it's in between sprinting of 100m and skill running of 1500m. I also saw that most of the slopes of the distances are around the same amount. Even though we do not have the final results for 1500m and 800m yet, based on other predictions I will expect them to be pretty close to my predictions. Another observation is that even though the times taken in general decrease over the years, the scores of the next Olympics are not necessarily always better than of the previous ones.
Where to find what:
The graph I used is located on the bottom. I stuck to the men's side of athletics. On the top is a chart that displays the length of the course, the predicted value for both 2012 and 2016, the actual value of the scores for both years, and the error percentage.
Thank you Thuong for you explanations, keep up the good work.
100m -> 9.5s Actual was 9.81s
200m -> 18.7s Actual was 19.78s
400m -> 40.12s Actual was 43.03s
800m -> 104.2s Actual was 102.15s
1500m -> 211.4s Actual was 230s
Thuong from ISM school sent in the following:
It came to me that the seconds taken should decrease with the years, so I decided to draw a line graph and draw a line between the values of 1908 and 1948. Then, I drew the line and stopped it when it was directly above the year I wanted (either 2012 or 2016). After doing this, I would be able to see my prediction. I knew that my prediction wouldn't be exact, but in this way, I could estimate where the values would be around. I then looked at the actual values and calculated the error percentage. With this data, I made a chart to display all of the info I had.
About the results:
I think that my predictions were pretty accurate, but I wonder why the 400m prediction's error percentage is so much higher than the others' error percentages. I believe that it's in between sprinting of 100m and skill running of 1500m. I also saw that most of the slopes of the distances are around the same amount. Even though we do not have the final results for 1500m and 800m yet, based on other predictions I will expect them to be pretty close to my predictions. Another observation is that even though the times taken in general decrease over the years, the scores of the next Olympics are not necessarily always better than of the previous ones.
Where to find what:
The graph I used is located on the bottom. I stuck to the men's side of athletics. On the top is a chart that displays the length of the course, the predicted value for both 2012 and 2016, the actual value of the scores for both years, and the error percentage.
Thank you Thuong for you explanations, keep up the good work.
You may also like
Going for Gold
Looking at the 2012 Olympic Medal table, can you see how the data is organised? Could the results be presented differently to give another nation the top place?
Olympic Starters
Look at some of the results from the Olympic Games in the past. How do you compare if you try some similar activities?