Skip over navigation


 How confident are you in your guesses?
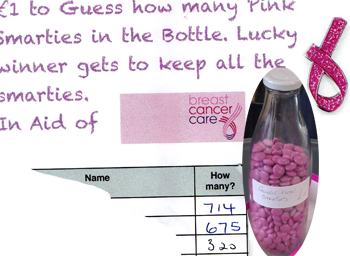
Fill a container with jelly beans (or similar small items) and ask as many people as possible to guess how many there are
Ask them to specify a range which they are 90% sure contains the right answer.
So for instance if you look at the container of sweets and think there's probably somewhere around 600, you might say you think there are 9 chances out of 10 that the correct answer is between 500 and 700.
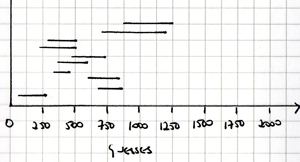
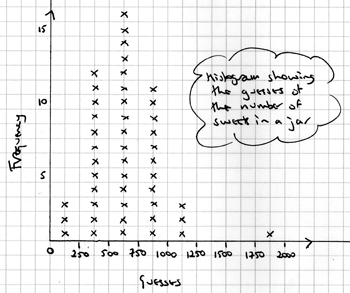 Record the results of your survey on graphs. You could show the mid-point of each person's range on a histogram, and the ranges on a separate graph, to avoid confusion.
Now count the number of sweets in the container.
How many of the guessed intervals contained the right answer?
Are you surprised at what you find?


How Confident Are You?
Age 11 to 16
Challenge Level 

How confident are you in your guesses?Fill a container with jelly beans (or similar small items) and ask as many people as possible to guess how many there are
- but don't just ask them for a simple guess!
Ask them to specify a range which they are 90% sure contains the right answer.
So for instance if you look at the container of sweets and think there's probably somewhere around 600, you might say you think there are 9 chances out of 10 that the correct answer is between 500 and 700.
Record the results of your survey on graphs. You could show the mid-point of each person's range on a histogram, and the ranges on a separate graph, to avoid confusion.Now count the number of sweets in the container.
How many of the guessed intervals contained the right answer?
Are you surprised at what you find?
You may also like
To Insure or Not to Insure
Should you insure your mobile phone? It rather depends on whether you focus on the long-term pay-off or the effect of a single event.
Louis' Ice Cream Business
Should Louis go for the safer options, hoping to limit his losses, or would he be better off with a riskier strategy, focusing on maximising his profit?
Capture and Recapture
How do scientists or mathematicians estimate the size of a population of wild animals?