Skip over navigation


A series of jam jars of uniform cross section look like letters when viewed face-on. They are 1cm thick, and the corners of the vessels have either whole or half cm values for their coordinates.
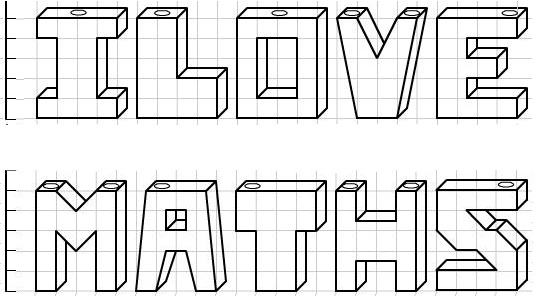
Hot, smooth jam is poured slowly into each vessel through one of the holes at the top at a rate of 1 cm$^3$ per second.
Seven of the jam jars take the same time to fill up. Which are they?
Which one takes the longest to fill?
Which would fill up first?
The height of the jam in one of the vessels is measured and a chart of the height against time is plotted, as follows:
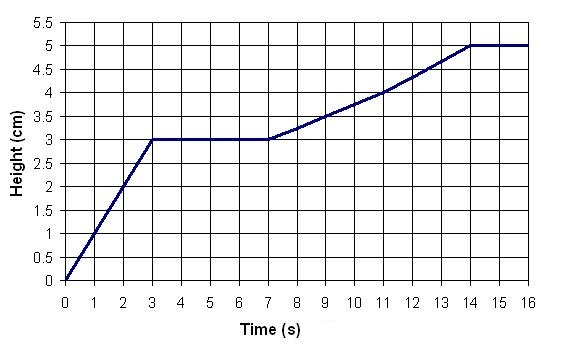
Which jam jars does this chart correspond to? Can you explain what each part of the chart corresponds to?
The very observant jam maker might have noticed that the chart given is actually slightly inaccurate: at certain points it is an over-measurement and at certain points it is an under-measurement. Can you see where and why?
Make charts of height against time for some of the other letters.
p.s. If you feel the need to question the 'runnyness' of the jam, we can assume that it is of low viscosity, contains no 'bits' and remains at the same temperature throughout. You can decide on the flavour. You might also like thinking about this problem.

Mathsjam Jars
Age 14 to 16
Challenge Level 

A series of jam jars of uniform cross section look like letters when viewed face-on. They are 1cm thick, and the corners of the vessels have either whole or half cm values for their coordinates.
Hot, smooth jam is poured slowly into each vessel through one of the holes at the top at a rate of 1 cm$^3$ per second.
Seven of the jam jars take the same time to fill up. Which are they?
Which one takes the longest to fill?
Which would fill up first?
The height of the jam in one of the vessels is measured and a chart of the height against time is plotted, as follows:
Which jam jars does this chart correspond to? Can you explain what each part of the chart corresponds to?
The very observant jam maker might have noticed that the chart given is actually slightly inaccurate: at certain points it is an over-measurement and at certain points it is an under-measurement. Can you see where and why?
Make charts of height against time for some of the other letters.
p.s. If you feel the need to question the 'runnyness' of the jam, we can assume that it is of low viscosity, contains no 'bits' and remains at the same temperature throughout. You can decide on the flavour. You might also like thinking about this problem.
You may also like
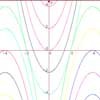
Parabolic Patterns
The illustration shows the graphs of fifteen functions. Two of them have equations y=x^2 and y=-(x-4)^2. Find the equations of all the other graphs.
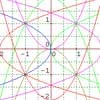
More Parabolic Patterns
The illustration shows the graphs of twelve functions. Three of them have equations y=x^2, x=y^2 and x=-y^2+2. Find the equations of all the other graphs.
Exploring Cubic Functions
Quadratic graphs are very familiar, but what patterns can you explore with cubics?