Skip over navigation
Cambridge University Faculty of Mathematics NRich logo
menu search
  • Teachers expand_more
    • Early years
    • Primary
    • Secondary
    • Post-16
    • Events
    • Professional development
  • Students expand_more
    • Primary
    • Secondary
    • Post-16
  • Parents expand_more
    • Early Years
    • Primary
    • Secondary
    • Post-16
  • Problem-Solving Schools
  • About NRICH expand_more
    • About us
    • Impact stories
    • Support us
    • Our funders
    • Contact us
  • search

Or search by topic

Number and algebra

  • The Number System and Place Value
  • Calculations and Numerical Methods
  • Fractions, Decimals, Percentages, Ratio and Proportion
  • Properties of Numbers
  • Patterns, Sequences and Structure
  • Algebraic expressions, equations and formulae
  • Coordinates, Functions and Graphs

Geometry and measure

  • Angles, Polygons, and Geometrical Proof
  • 3D Geometry, Shape and Space
  • Measuring and calculating with units
  • Transformations and constructions
  • Pythagoras and Trigonometry
  • Vectors and Matrices

Probability and statistics

  • Handling, Processing and Representing Data
  • Probability

Working mathematically

  • Thinking mathematically
  • Developing positive attitudes
  • Cross-curricular contexts

Advanced mathematics

  • Decision Mathematics and Combinatorics
  • Advanced Probability and Statistics
  • Mechanics
  • Calculus

For younger learners

  • Early Years Foundation Stage

Probability Through Problems

Probability Through Problems: a new approach to teaching probability

Age 11 to 16

Introducing Probability

Age 11 to 16

What is our approach about?

Why Start with Tree Diagrams?

Age 11 to 14

Why the tree diagram is fundamental to studying probability - and why it should be introduced right from the start.

Probability Calculations from Tree Diagrams

Age 11 to 16

Progression from natural frequencies to proportions to the multiplication rule, and hence to probability trees.

Learning Probability Through Mathematical Modelling

Age 11 to 16

Moving from the particular to the general, then revisiting the particular in that light, and so generalising further.

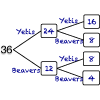
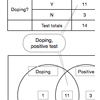
Tree Diagrams, 2-way Tables and Venn Diagrams

Age 11 to 18

Representing frequencies and probabilities diagrammatically, and using the diagrams as interpretive tools.

Independence and Dependence

Age 11 to 18

When are events independent of each other? Sampling with and without replacement.

Conditional Probability Is Important for All Students!

Age 11 to 18

Understanding statistics about testing for cancer or the chance that two babies in a family could die of SIDS is a crucial skill for ALL students.

  • Tech help
  • Accessibility Statement
  • Sign up to our newsletter
  • Twitter X logo

The NRICH Project aims to enrich the mathematical experiences of all learners. To support this aim, members of the NRICH team work in a wide range of capacities, including providing professional development for teachers wishing to embed rich mathematical tasks into everyday classroom practice.

NRICH is part of the family of activities in the Millennium Mathematics Project.

University of Cambridge logo NRICH logo