Skip over navigation

Or search by topic
Number and algebra
Geometry and measure
Probability and statistics
Working mathematically
Advanced mathematics
For younger learners
Robin's Hypothesis Testing
Age 16 to 18
Challenge Level 


Robin has a bag containing red and green balls. Robin wants to test the following hypotheses, where $\pi$ is the proportion of green balls in the bag:
Robin is allowed to take out a ball at random, note its colour and then replace it: this is called a trial. Robin can do lots of trials, but each trial has a certain cost.
Robin wants to test these hypotheses as cheaply as possible, so suggests the following approach:
Robin tells you about this plan. What advice could you give to Robin?
Warning - the computer needs a little bit of thinking time to do the simulations!
In this simulation, you can:
Here are some questions you could consider as you think about Robin's approach:
Rejecting $H_0$ when it is true is called a Type I error.
This resource was inspired by the controversy surrounding a paper published in Nature Communications, as discussed by Casper Albers here.
This resource is part of the collection Statistics - Maths of Real Life
$H_0\colon \pi=\frac{1}{2}$ and $H_1\colon \pi\ne\frac{1}{2}$
Robin is allowed to take out a ball at random, note its colour and then replace it: this is called a trial. Robin can do lots of trials, but each trial has a certain cost.
Robin wants to test these hypotheses as cheaply as possible, so suggests the following approach:
"I will do at most 50 trials. If the p-value* drops below 0.05 at any point, then I will stop and reject the null hypothesis at the 5% significance level, otherwise I will accept it."
Robin tells you about this plan. What advice could you give to Robin?
Warning - the computer needs a little bit of thinking time to do the simulations!
In this simulation, you can:
- specify the number of green and red balls actually in the bag (and the true ratio is shown with a green dashed line on the graph) - note that in a real experiment we would not know this!
- specify the number of trials (up to 200)
- specify the proportion for the null hypothesis (which we took to be $\frac{1}{2}$ above)
- choose whether to show the proportion of green balls after each ball is picked
- choose whether to show the p-value after each ball is picked*
- rerun the simulation ("Repeat experiment")
Here are some questions you could consider as you think about Robin's approach:
- What do you notice about the patterns of proportions and p-values? Is there anything which is the same every time or most times you run the simulation?
- If we repeat the experiment lots of times, how often does $H_0$ get rejected using Robin's approach? Does the answer to this depend on how many trials we perform?
- Does the answer change if you change the true proportion of greens in the bag?
- What would happen if you changed the hypothesised proportion $\pi$?
- What would happen if you changed the significance level from 5% to 10% or 1%?
Rejecting $H_0$ when it is true is called a Type I error.
* To read more about p-values, have a look at What is a Hypothesis Test? The p-values here are calculated like this: after $k$ trials, we find twice the probability of obtaining this number of greens or a more extreme number in $k$ trials, assuming that $H_0$ is true. The graph shows how this p-value changes with
$k$.
This resource was inspired by the controversy surrounding a paper published in Nature Communications, as discussed by Casper Albers here.
This resource is part of the collection Statistics - Maths of Real Life
You may also like
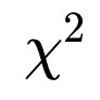
Chi-squared Faker
How would you massage the data in this Chi-squared test to both accept and reject the hypothesis?

