Skip over navigation

Or search by topic
Number and algebra
Geometry and measure
Probability and statistics
Working mathematically
Advanced mathematics
For younger learners
Hypothetical Shorts
Age 16 to 18
Challenge Level 


- Problem
- Getting Started
- Student Solutions
- Teachers' Resources
- A significance level of 5% means that there is a 5% probability of getting a test statistic in the critical region if the null hypothesis is true.
This is at least approximately true, and in some cases it is true. But it may be that the critical region has a probability of a little less than 0.05, for example with a binomial distribution test where it is impossible obtain a probability of exactly 0.05.
Furthermore, for the 5% probability to be correct, we also have to assume that all of our assumptions are correct. This includes: we have the right model of the situation and there are no unaccounted-for factors; our observations are independent (if we are assuming them to be); we have no systematic bias; if we are asking people questions, their answers are honest, and so on. In practice, this is never the case; we just do our best to minimise these factors.
- A significance level of 5% means that there is a 5% probability of the null hypothesis being true if the test statistic lies in the critical region.
This is false: the order of dependency is the wrong way round. See the previous question.
- The p-value of an experiment gives the probability of the null hypothesis being true.
False. We have little idea of the probability of the null hypothesis being true. The p-value tells us only the probability of obtaining this result or a more extreme one if the null hypothesis is true. Even in a Bayesian setup, the posterior probability of the null hypothesis being true is not equal to the p-value.
- If the p-value is less than 0.05, then the alternative hypothesis is true.
We certainly cannot say anything as certain as this! We can only talk in terms of probabilities.
- If the p-value is less than 0.05, then the alternative hypothesis is more likely to be true than the null hypothesis.
This depends at least upon the p-value and the prior beliefs about the probability of the alternative hypothesis being true. See What is a Hypothesis Test?
- The closer the p-value is to 1, the greater the probability that the null hypothesis is true.
It may well be true, but for a somewhat subtle reason. If the null hypothesis is true, the p-value could take values in the range 0 to 1, and roughly p of the time, it will be less than p, so larger values and smaller values are equally likely if the null hypothesis is true. If the alternative hypothesis is true, though, then smaller p-values are more likely than larger p-values. So this seems likely to be true. To prove it, though, one could use the results derived in What is a Hypothesis Test?, together with a determination of $\mathrm{P}(\mathrm{p}^+|H_1)$ for different p-values. Drawing a graph showing either $\mathrm{P}(H_1|\mathrm{p}^+)$ or $\mathrm{P}(H_0|\mathrm{p}^+) = 1 - \mathrm{P}(H_1|\mathrm{p}^+)$ against the p-value would show whether - for this case of $\mathrm{P}(\mathrm{p}^+|H_1)$ at least - this statement is true.
- If we have a larger sample size, we will get a more reliable result from the hypothesis test.
We need to be clear what we mean by the word "reliable". Assuming that we mean something like "the probability of correctly accepting $H_0$ if it's true, and the probability of rejecting $H_0$ if the alternative hypothesis is true", then in general, a larger sample size will lead to a more reliable result. This can also be expressed in terms of the probabilities of a Type I or Type II error.
- If we repeat an experiment and we get a p-value less than 0.05 in either experiment, then we must reject the null hypothesis.
As an extreme case (illustrated in the referenced XKCD cartoon), if we repeat the experiment 20 times, it is likely that we will obtain a p-value less that 0.05 at least once. (The probability is over 0.6 - why?) So we cannot simply repeat an experiment multiple times and reject the null hypothesis if any of the p-values are less than 0.05: we need to take into account the fact that we are repeating the experiment and therefore need a p-value somewhat smaller than 0.05 to reject the null hypothesis at a significance level of 5%. Statisticians have calculated exactly how small the p-value would need to be in this case.
- If we do not get a significant result from our experiment, we should go on increasing our sample size until we do.
We can do a new experiment with a larger sample size, but (as discussed in the previous question) we need to be very careful about interpreting results when we do repeat experiments. In particular, we cannot simply repeat the experiment until we get a small p-value for that particular experiment and interpret it to mean that there is evidence for the alternative hypothesis.
You may also like
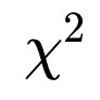
Chi-squared Faker
How would you massage the data in this Chi-squared test to both accept and reject the hypothesis?

